
معمل المباريات / كأس العالم 2022
النهائي · 2022-12-18
الأرجنتين 3–3 فرنسا
بعد الوقت الإضافي · فازت الأرجنتين بركلات الترجيح
استاد لوسيل · StatsBomb Open Data
العناوين والملخصات مُترجَمة. أدلة القراءة التفصيلية أدناه تبقى بالإنجليزية للدقة.
لماذا هذه المباراة مفيدة للتعلّم
- المباراة مشهورة، لذا المتعلمون يعرفون السرد مسبقاً — مما يسهل فصل القصة عن الأدلة.
- توزيع خلق الفرص كان غير متساوٍ بين الشوطين والوقت الإضافي. هذا يجبر على قراءة دقيقة لخرائط التسديد حسب المرحلة، وليس فقط حسب النتيجة النهائية.
- شبكة تمريرات الأرجنتين وخريطة التمريرات التقدمية تظهر تقدماً منظماً؛ استجابة فرنسا المتأخرة توضح كيف يمكن لحالة المباراة أن تغير الصورة دون إعادة كتابة العملية السابقة.
- ركلات الترجيح تقع في الفترة الخامسة من ملف البيانات المفتوحة. خلط تسديدات ركلات الترجيح مع xG اللعب المفتوح هو خطأ شائع تساعد هذه المباراة على كشفه.
سياق المباراة
كانت الأرجنتين متقدمة 2–0، وتعادلت فرنسا في وقت متأخر من الوقت الأصلي، وسجل كلا الفريقين مرة أخرى في الوقت الإضافي (3–3). ثم فازت الأرجنتين بركلات الترجيح.
للتعليم، اعتبر الوقت الأصلي + الوقت الإضافي (الفترات 1–4) كعملية المباراة. الفترة 5 (ركلات الترجيح) هي تمرين مختلف: محاولات xG عالية منفصلة تحت قواعد خاصة.
الفترات 1–4 (90 دقيقة + الوقت الإضافي)
الأرقام أدناه تستبعد ركلات الترجيح (الفترة 5) حتى لا تتشوه قراءة العملية بسبب xG ركلات الترجيح.
- الأرجنتين
- 20 تسديدات · 3 أهداف · ~2.76 xG
- تمريرات تقدمية: 130 (23.2% من التمريرات)
- فرنسا
- 10 تسديدات · 3 أهداف · ~2.27 xG
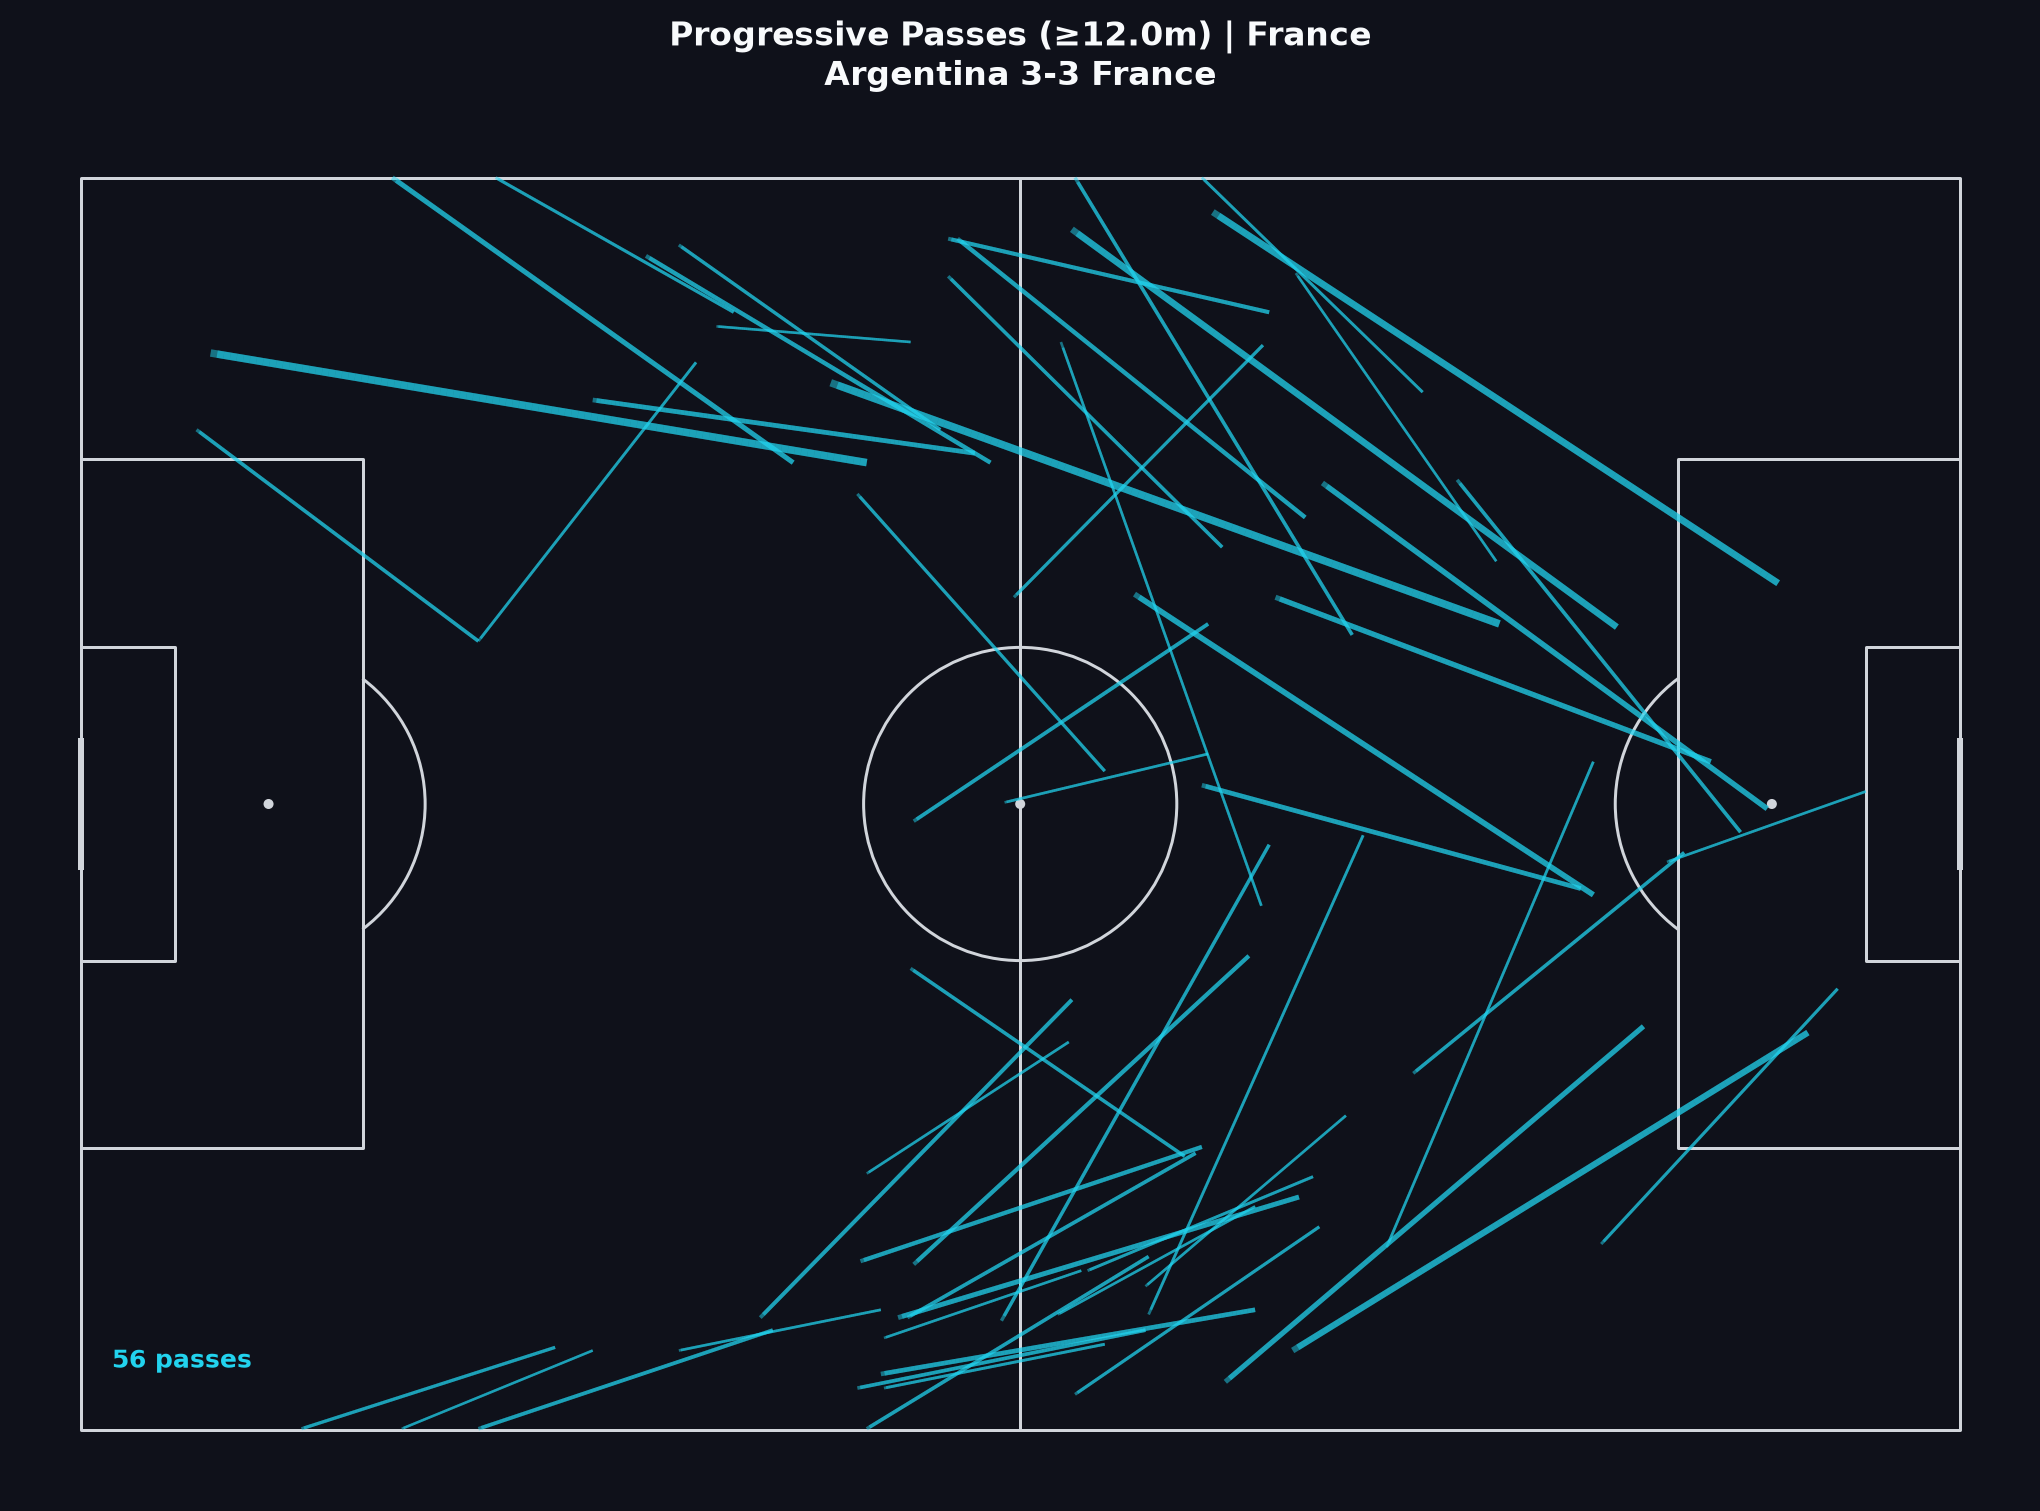
- تمريرات تقدمية: 56 (12.9% من التمريرات)
مرئي 1
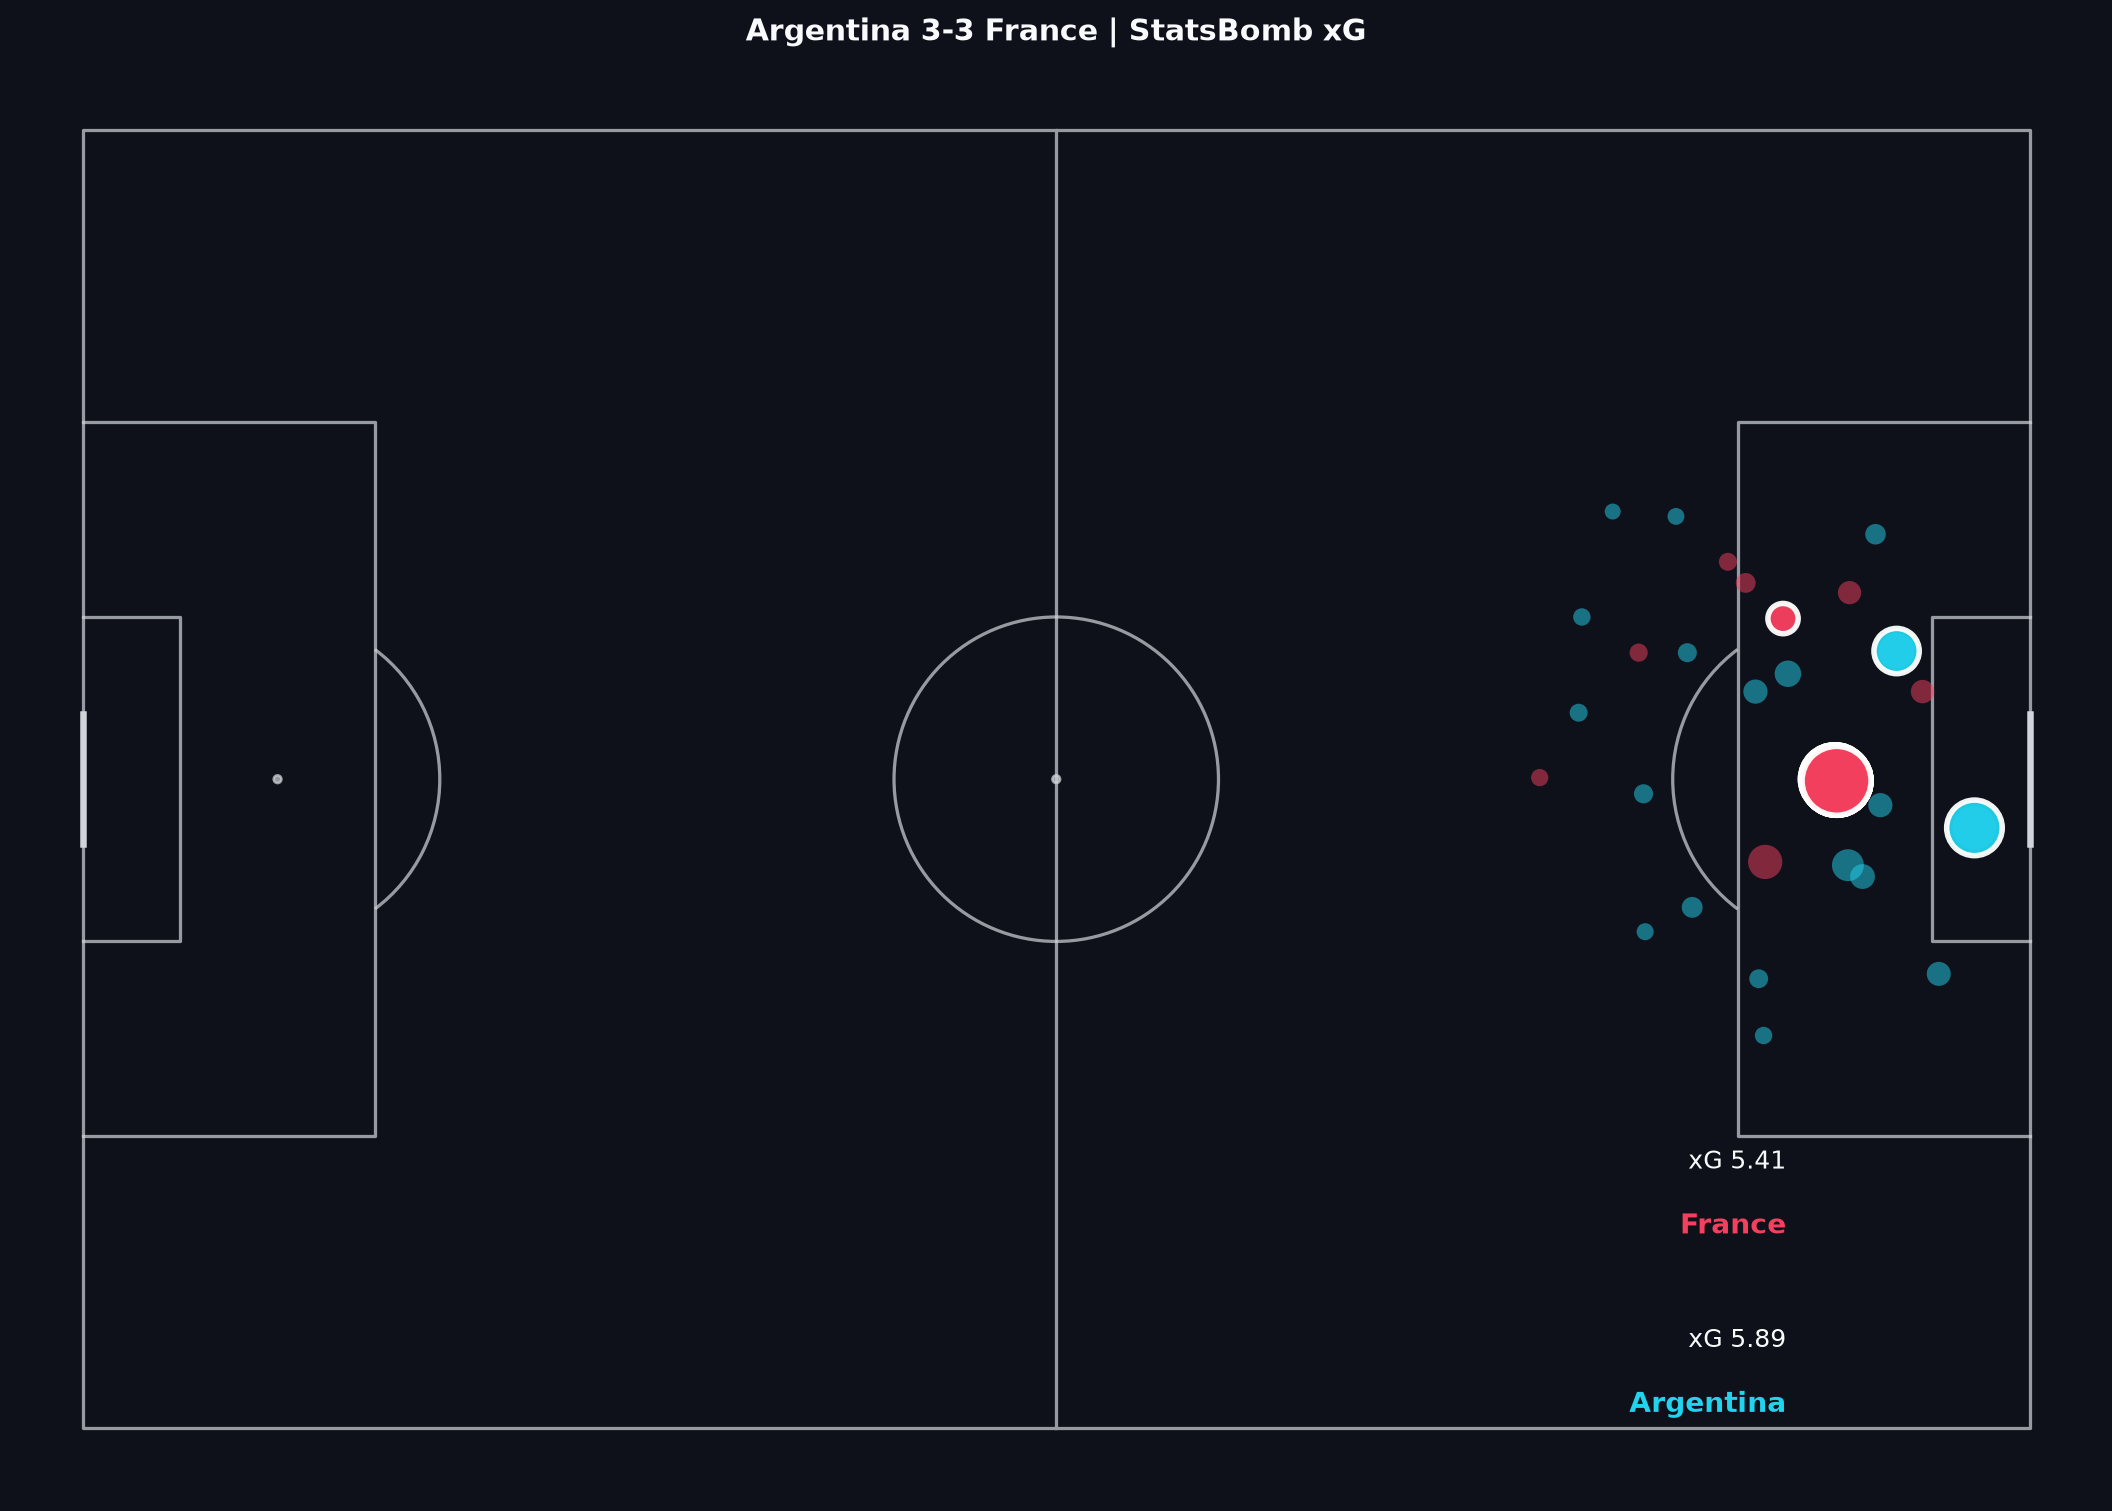
خريطة التسديدات
كل علامة تمثل تسديدة. الموقع، الحجم، والجودة أهم من عد النقاط. اقرأ هذه الخريطة مع ملاحظة الفترة أعلاه: العملية أولاً، ركلات الترجيح ثانياً.
كيف تقرأ هذا
نقاط «كيف تقرأ هذا» التفصيلية بالإنجليزية.
- Start with location clusters, not the scoreline. Central box attempts usually carry more historical goal probability than speculative efforts from distance.
- Compare volume and quality together. Argentina recorded more shots in periods 1–4; France’s conversion relative to fewer attempts is part of the late-game story, not proof that earlier Argentine control ‘did not matter’.
- Ask which chances came from open play versus set pieces, and whether a cluster reflects sustained territorial pressure or a short burst.
- Do not invent a formation story the map cannot prove. A shot map shows outcomes of chances, not every off-ball run that created them.
دروس Learn ذات الصلة
مرئي 2
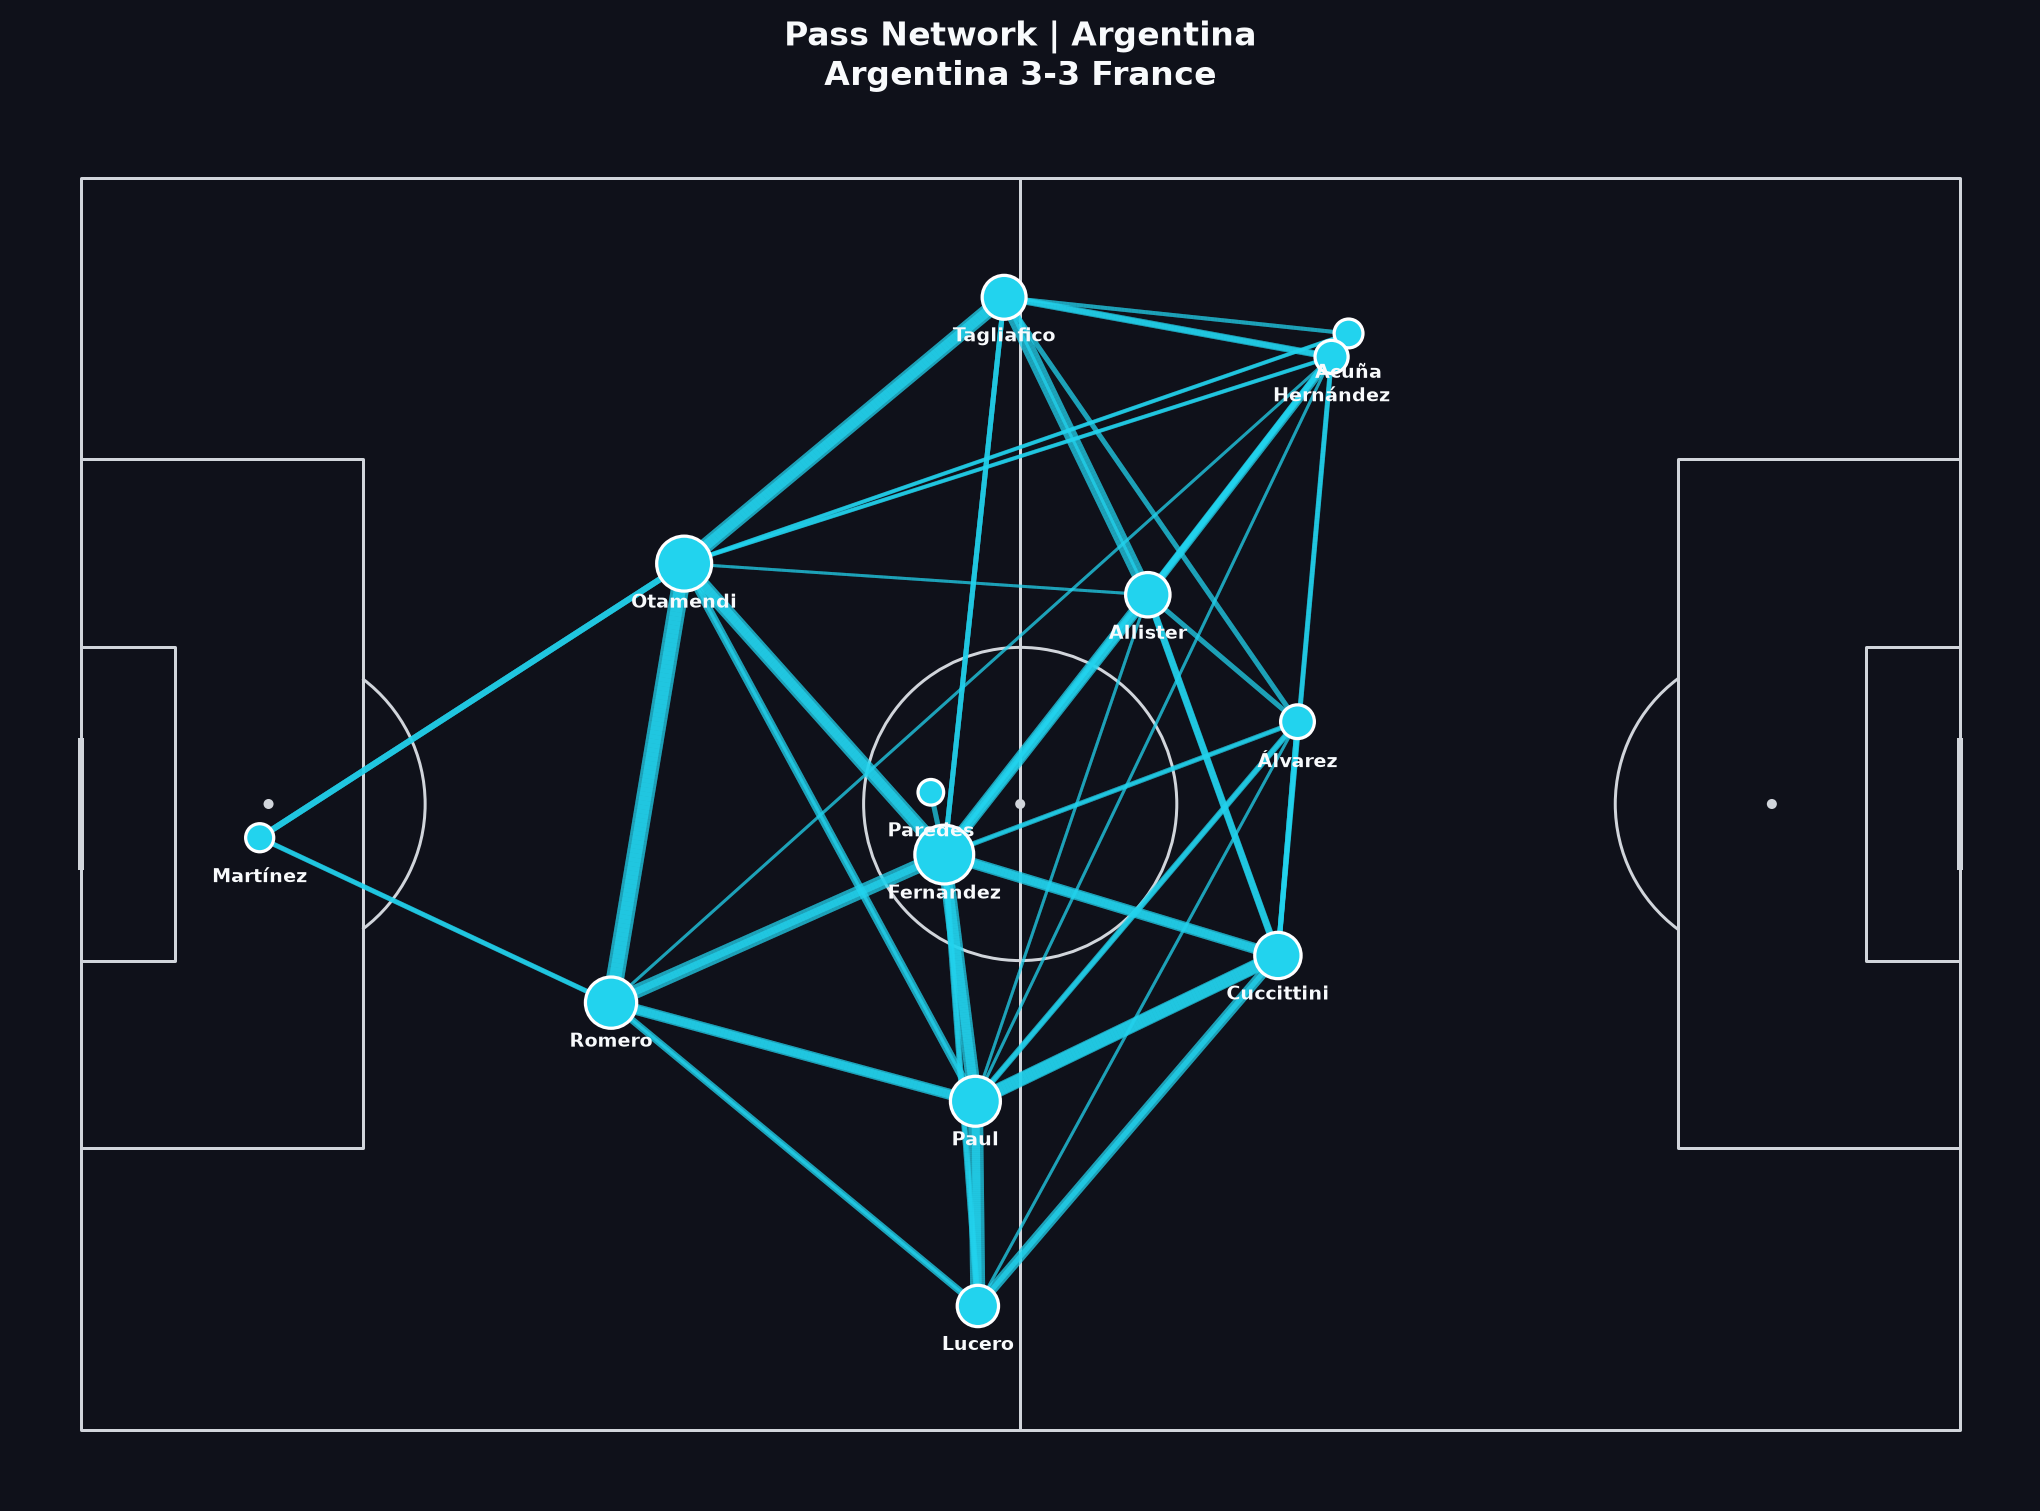
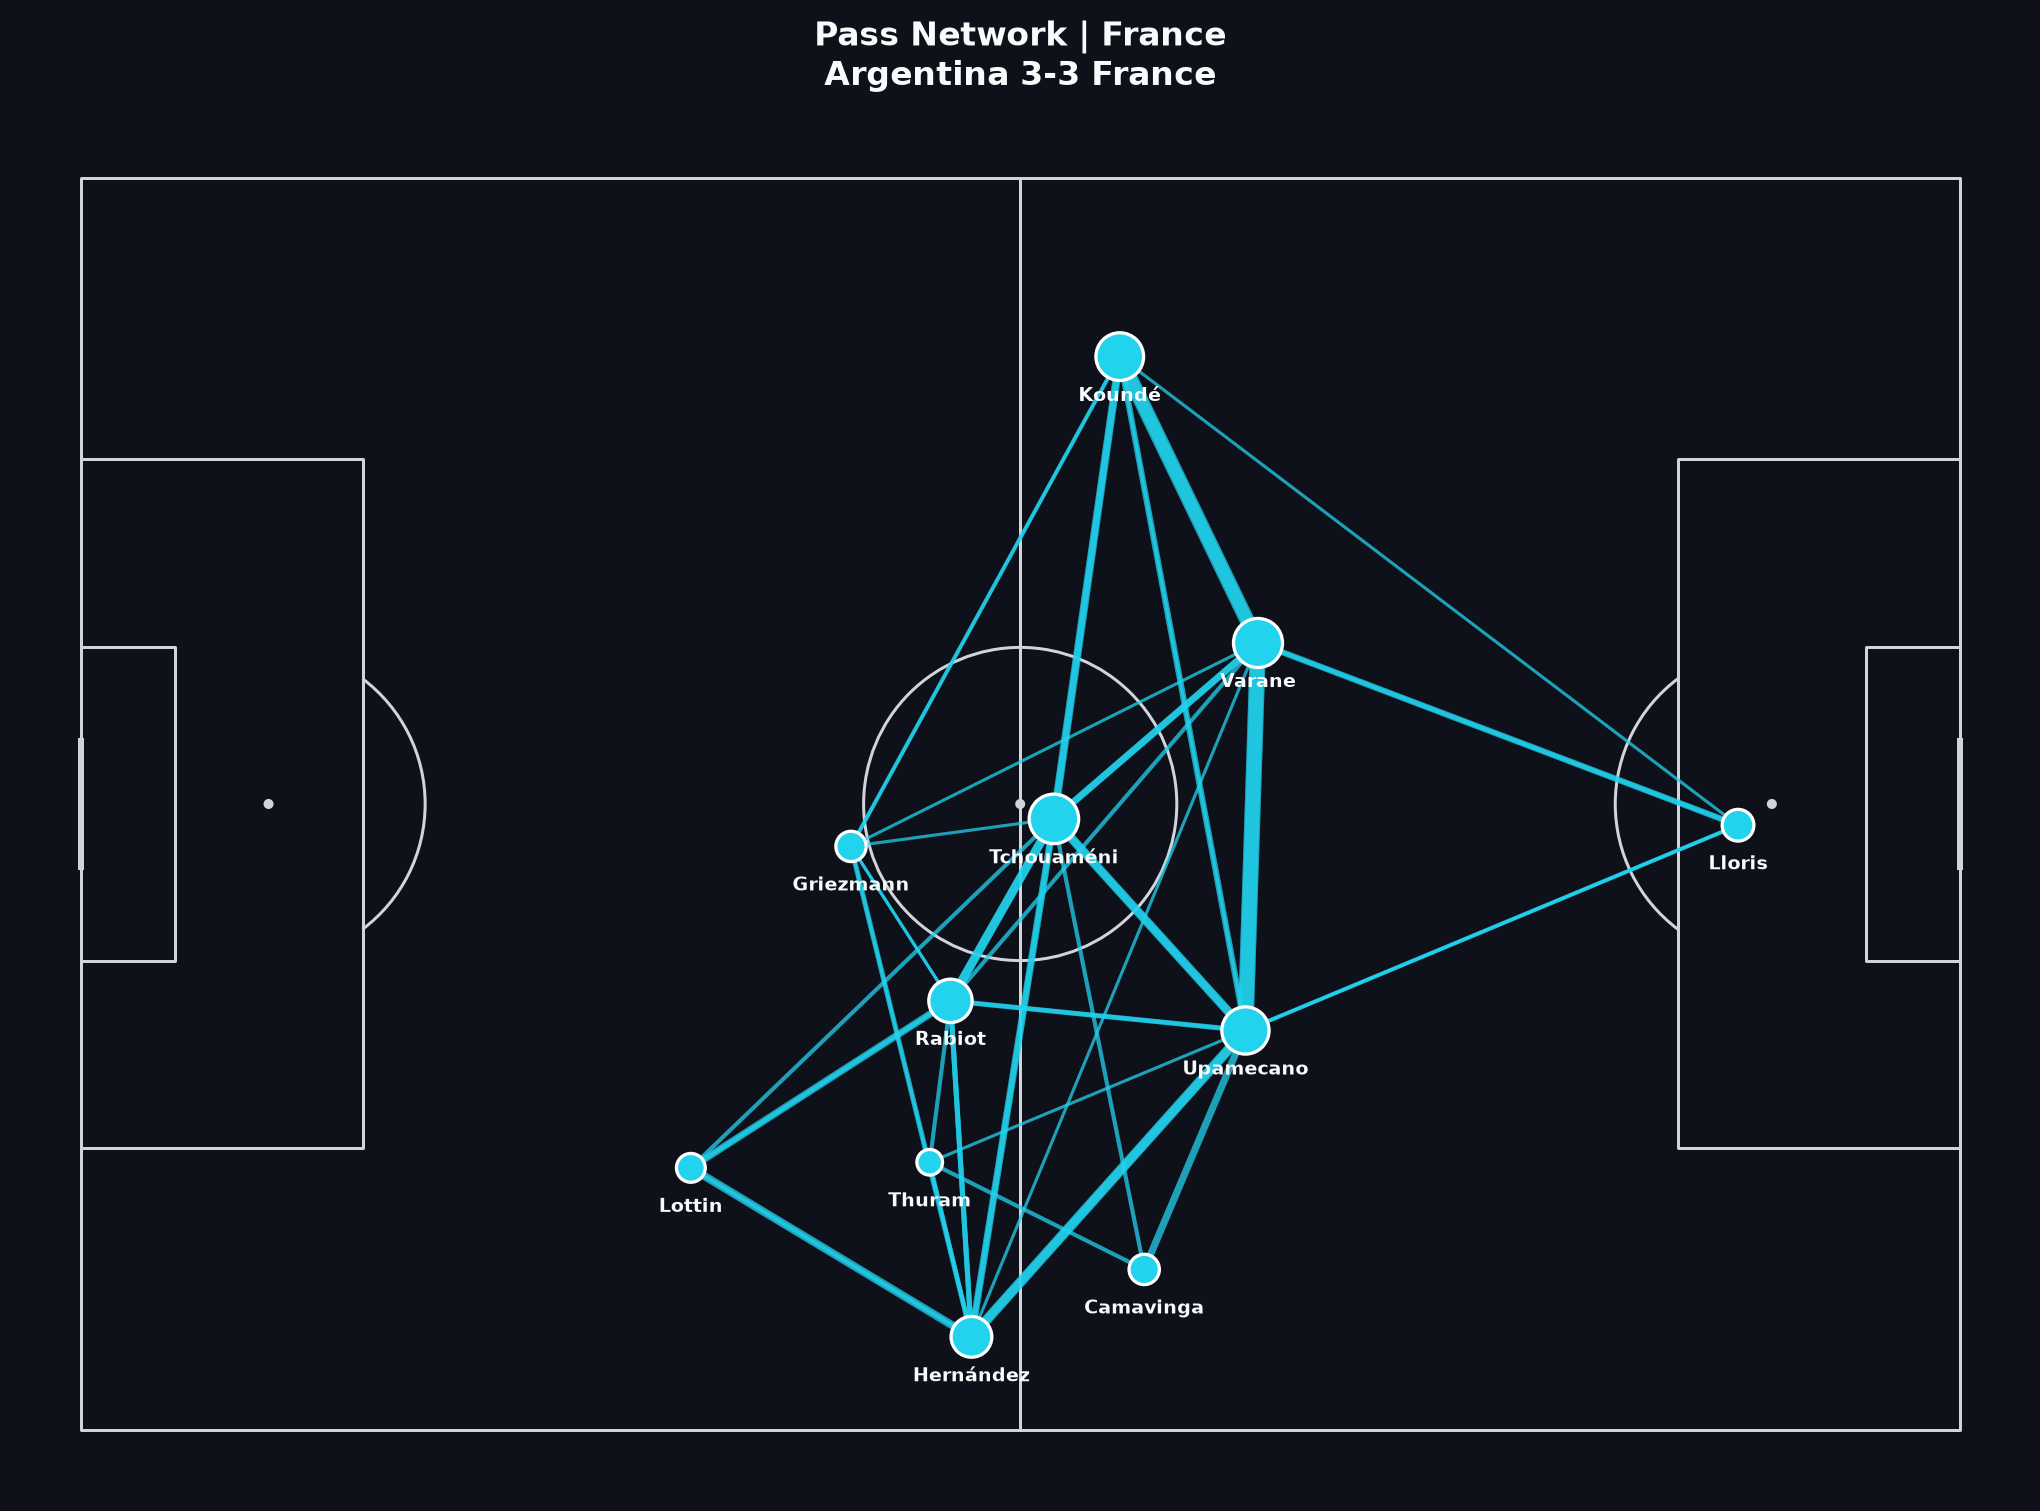
شبكة التمريرات
العقد تمثل اللاعبين (متوسط مواقع الكرة)؛ الحواف تظهر التمريرات المكتملة. الروابط الأثخن أو الأقوى تعني عادة تكرار التمريرات — وليس بالضرورة كرة أفضل.
كيف تقرأ هذا
نقاط «كيف تقرأ هذا» التفصيلية بالإنجليزية.
- Look for hubs and corridors. Who receives in central zones? Who connects the first line to the final third?
- A dense network on one flank can mean intentional overloads — or forced circulation away from pressure. Confirm with video before naming a ‘plan’.
- Compare Argentina’s denser progressive structure with France’s more selective connections. Difference in volume is informative; it is not a moral ranking.
- Substitutions and game state change networks. A final with long extra time mixes several match phases into one average picture.
دروس Learn ذات الصلة
مرئي 3
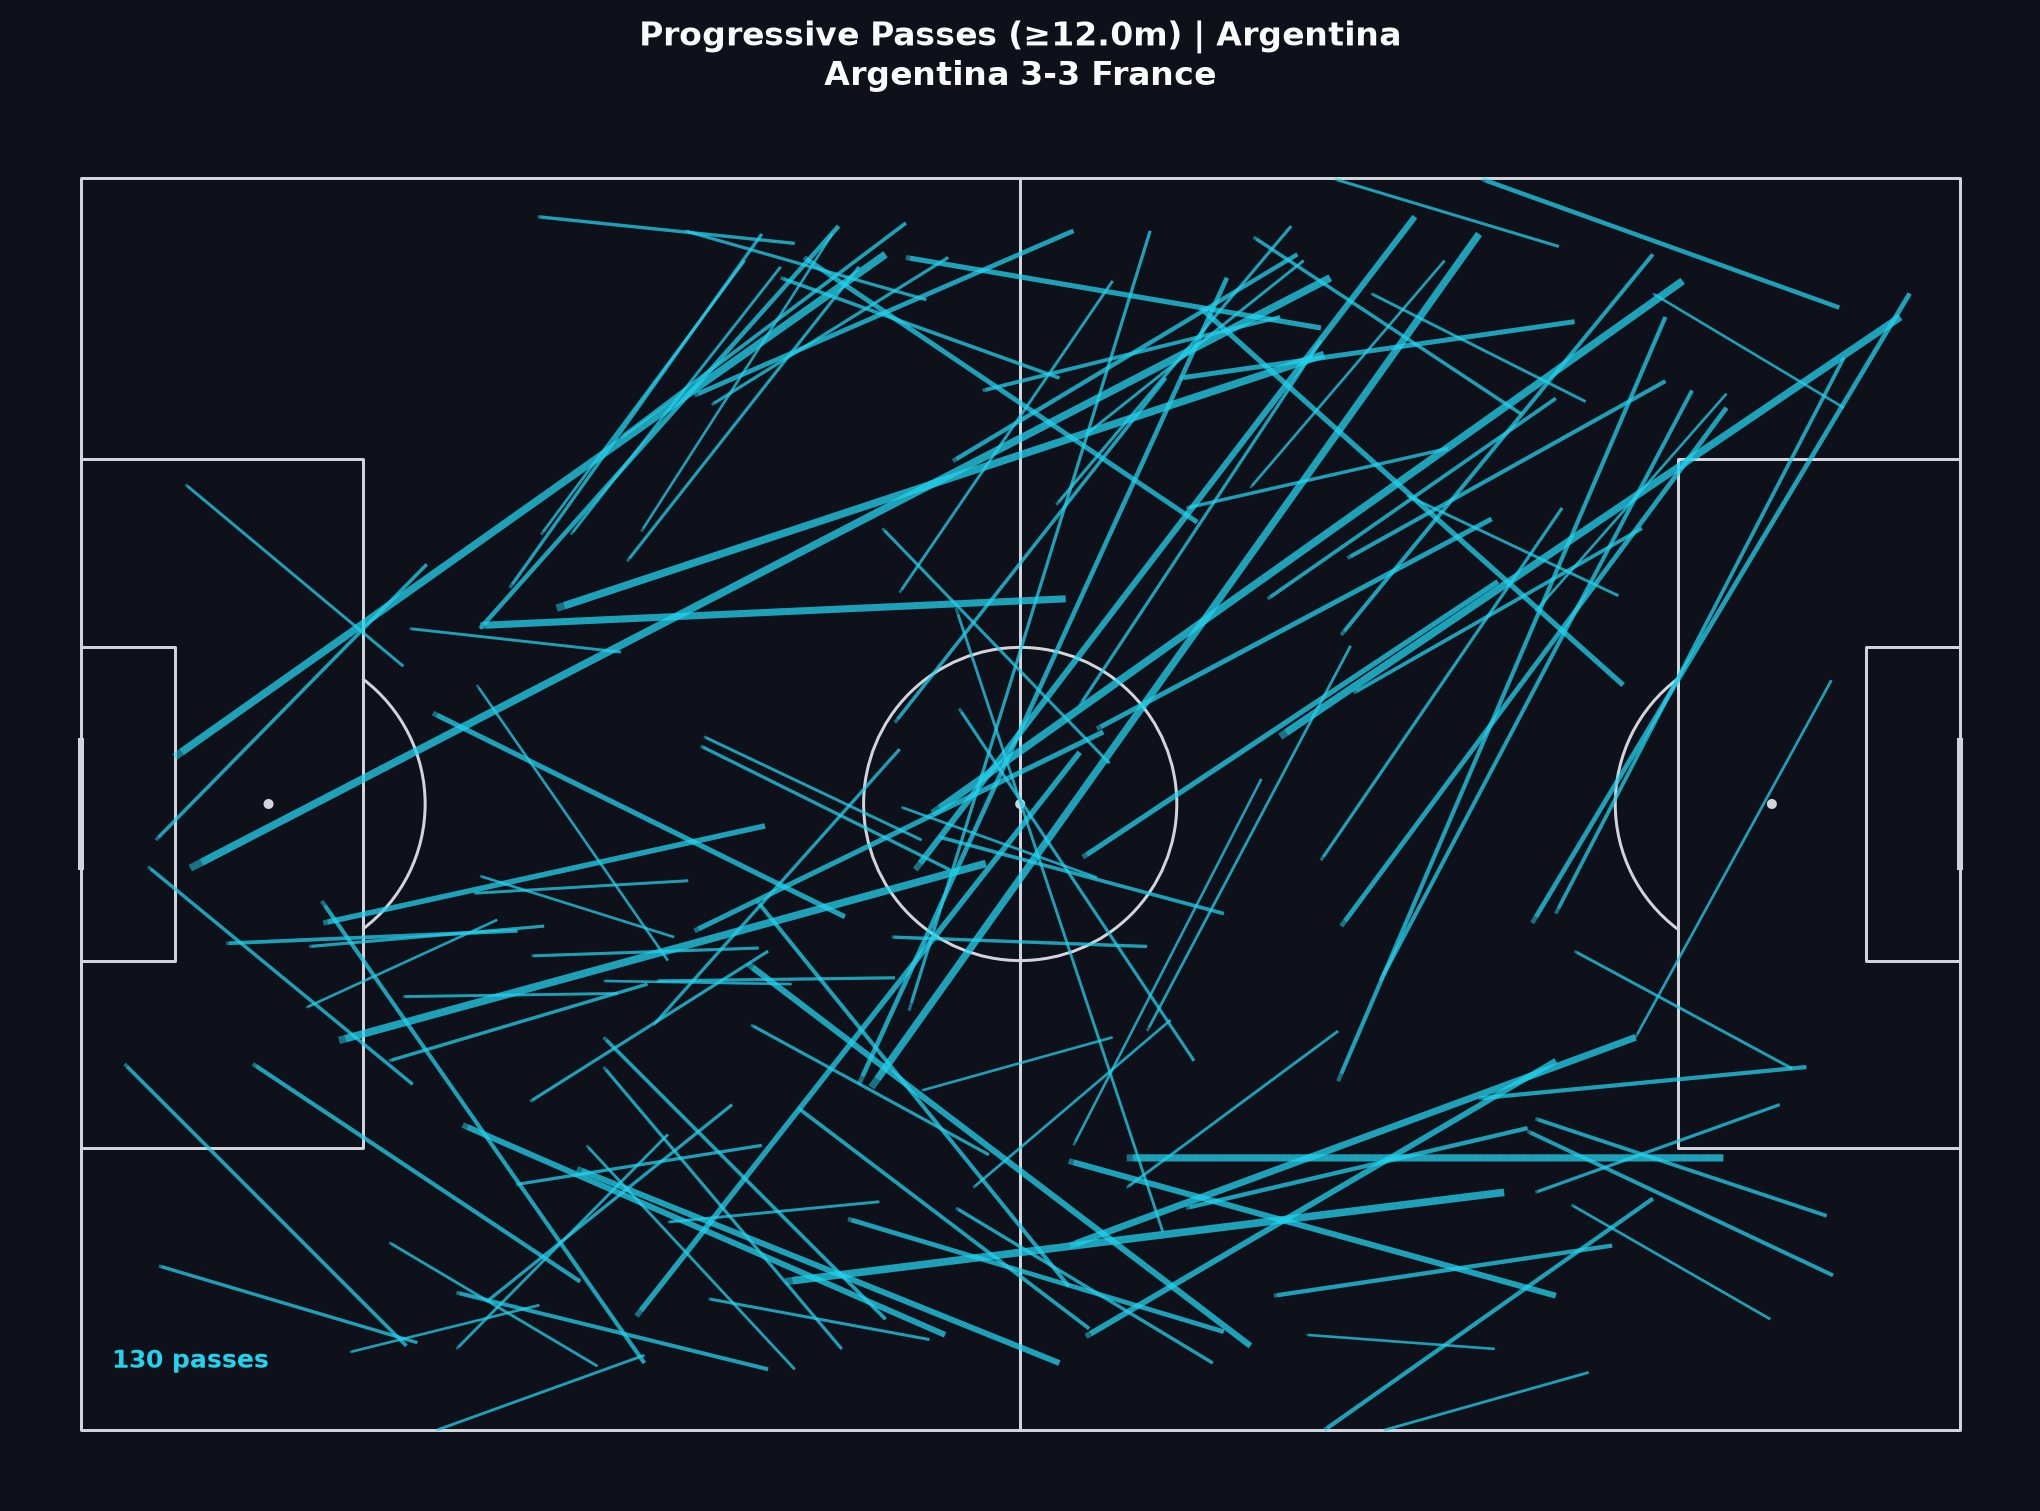
التمريرات التقدمية
التمريرات التقدمية تحرك الكرة بشكل معنوي نحو المرمى (هنا: على الأقل ~12 متراً من التقدم حسب تعريف football-ai المستخدم لرسم هذه الخرائط). تساعد على التمييز بين الاستحواذ العقيم والأراضي المكتسبة.
كيف تقرأ هذا
نقاط «كيف تقرأ هذا» التفصيلية بالإنجليزية.
- High progressive volume suggests a team repeatedly advanced the ball; it does not guarantee high-quality shots at the end of those advances.
- Argentina’s progressive share (~23% of passes in this rendering) is substantially higher than France’s (~13%). Read that as a process difference across the match file, then ask when France’s dangerous moments arrived.
- Trace start and end zones. Progression into the half-space or box carries different tactical meaning from sideways progress near halfway.
- Pair this map with the shot map: progression without shots can be sterile control; shots without progression can be transition or set-piece dependent.
دروس Learn ذات الصلة
مرئي 4
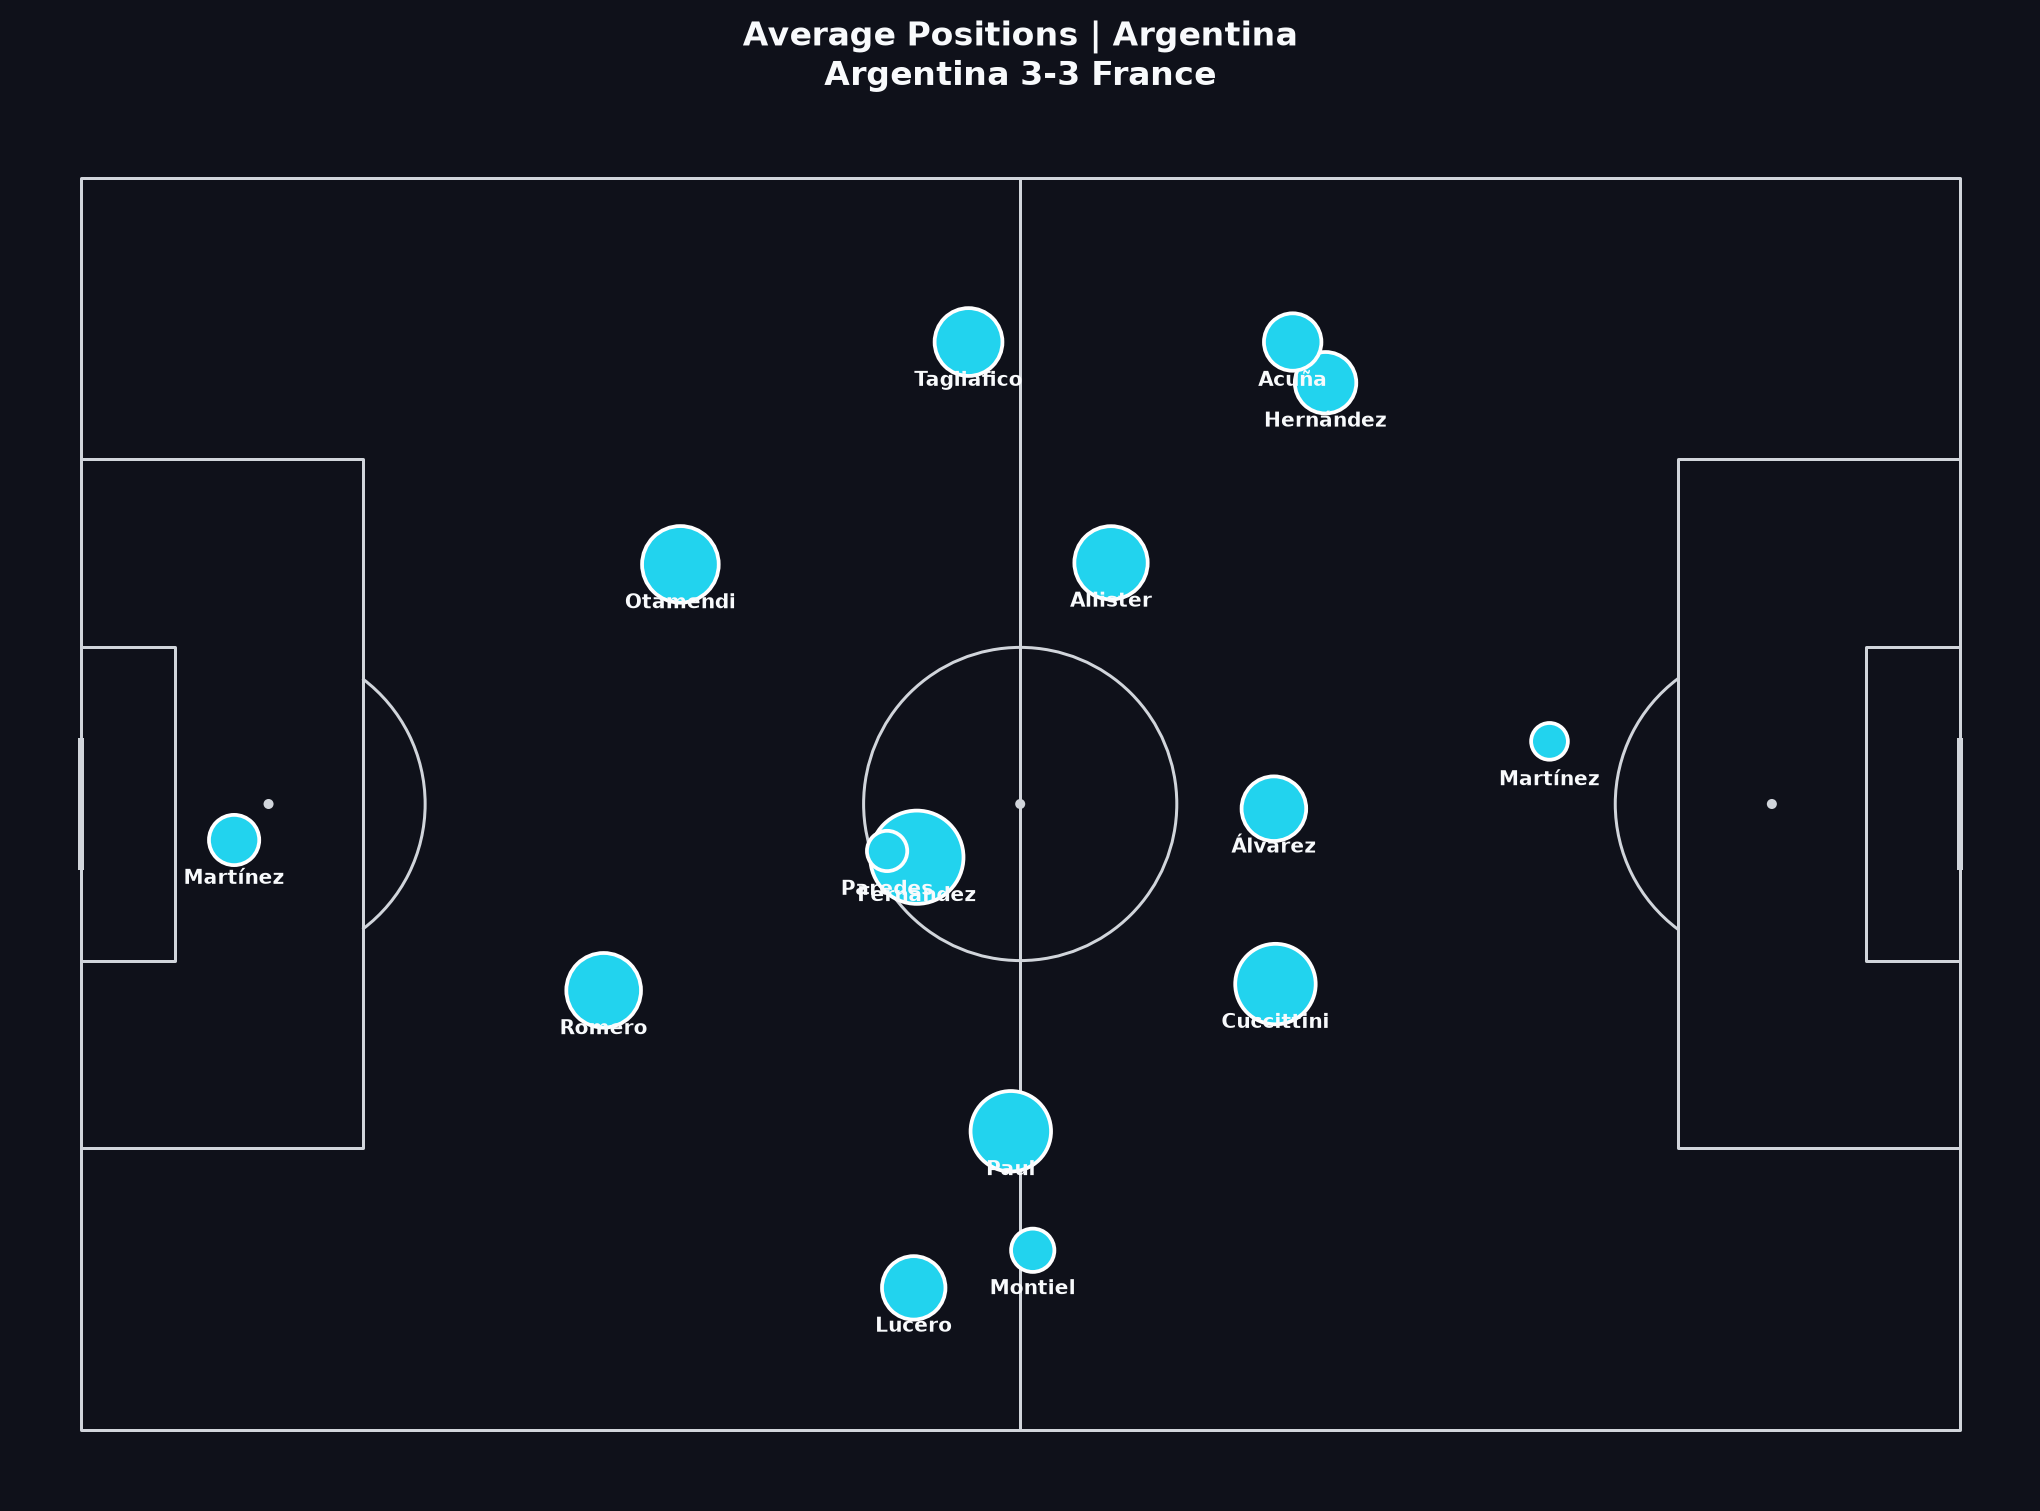
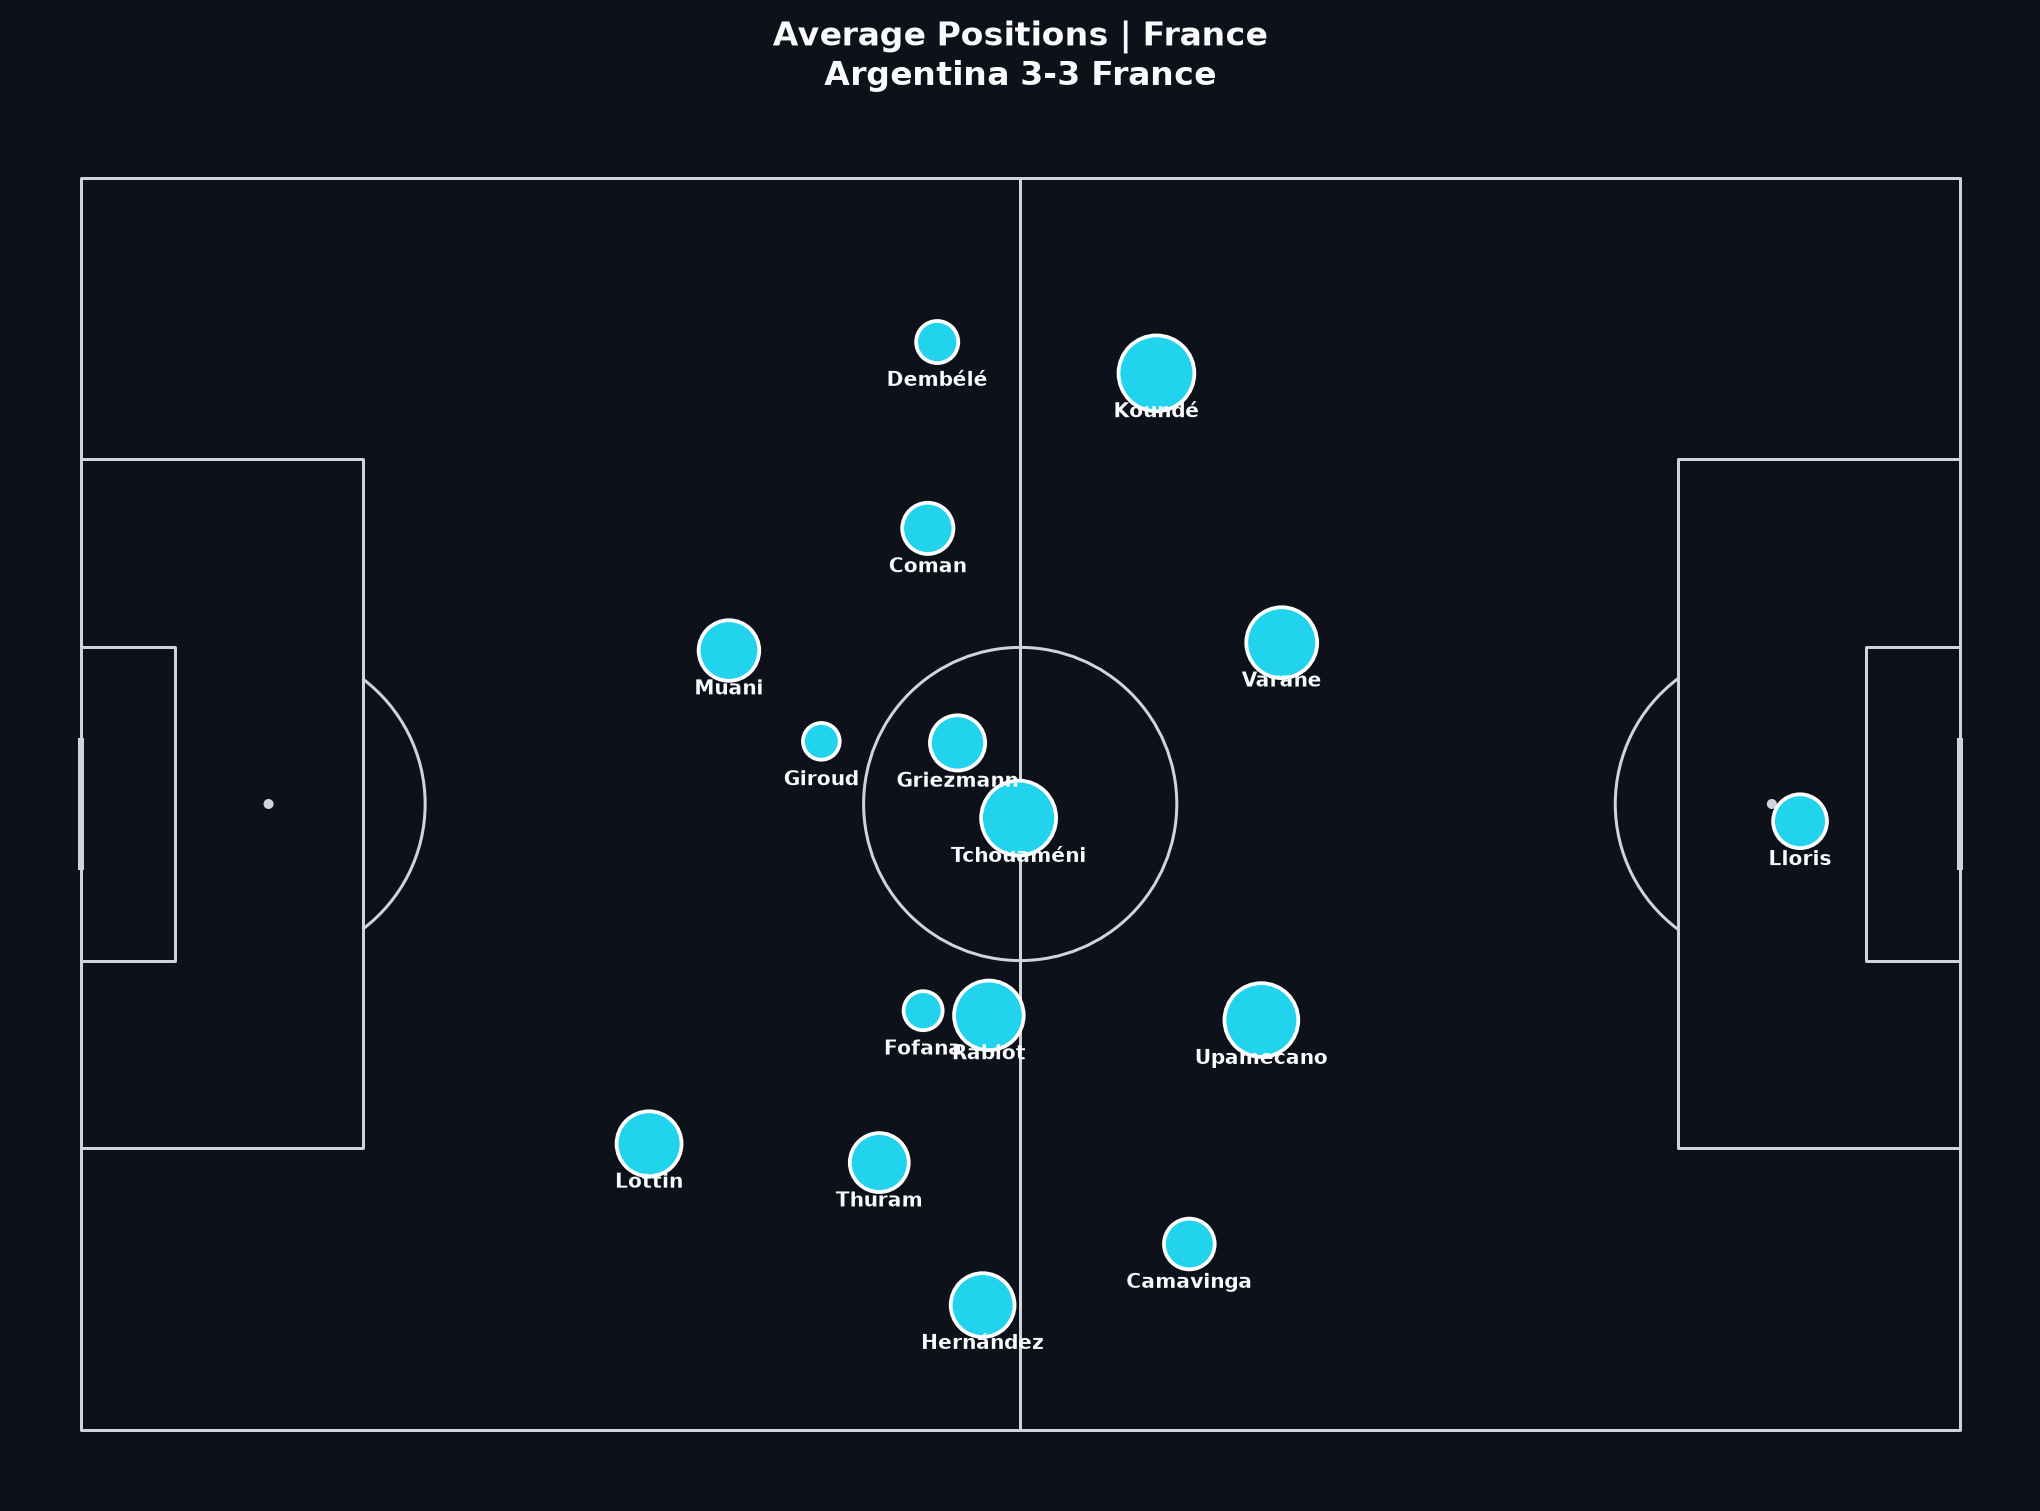
المواقع المتوسطة
العلامات تظهر متوسط مواقع تحركات الكرة للاعبين الذين لديهم عدد كافٍ من التحركات. هذا ليس مخطط تكتيكي من السبورة — بل ملخص مكاني لمواقع المشاركة.
كيف تقرأ هذا
نقاط «كيف تقرأ هذا» التفصيلية بالإنجليزية.
- Average position ≠ tactical role for every second. A full-back who inverts late will still leave a trail of earlier wide actions in the average.
- Use the plot to form hypotheses about height of engagement and central occupation, then test them on video clips.
- Compare the two sides’ vertical height. A higher average block can indicate territorial dominance or chasing a deficit — match state matters.
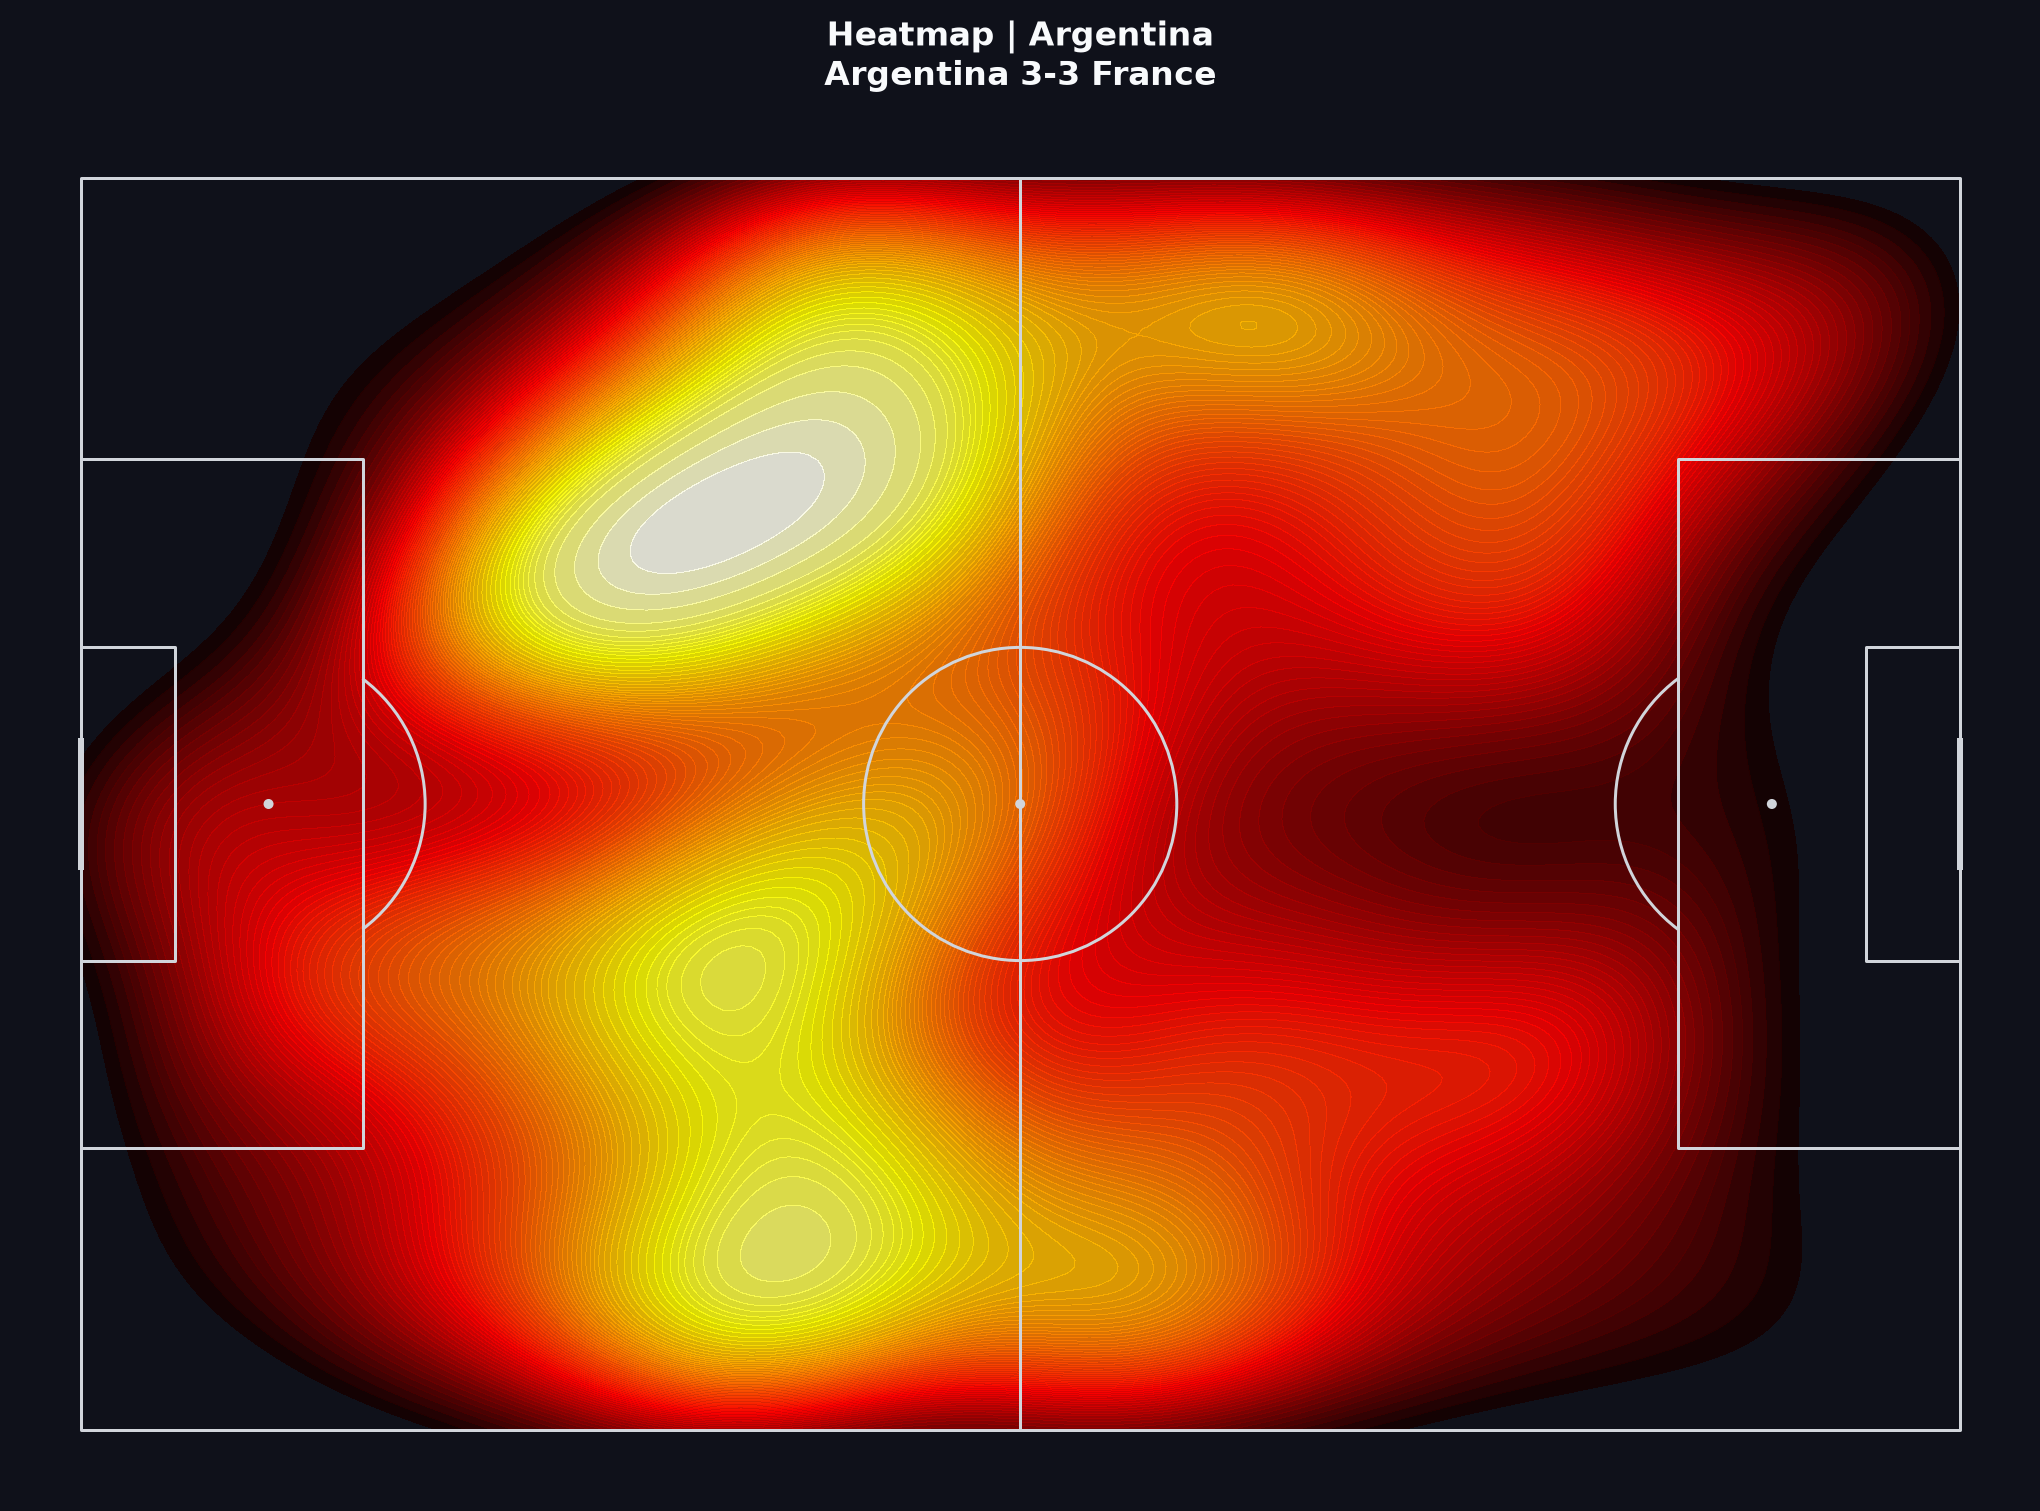
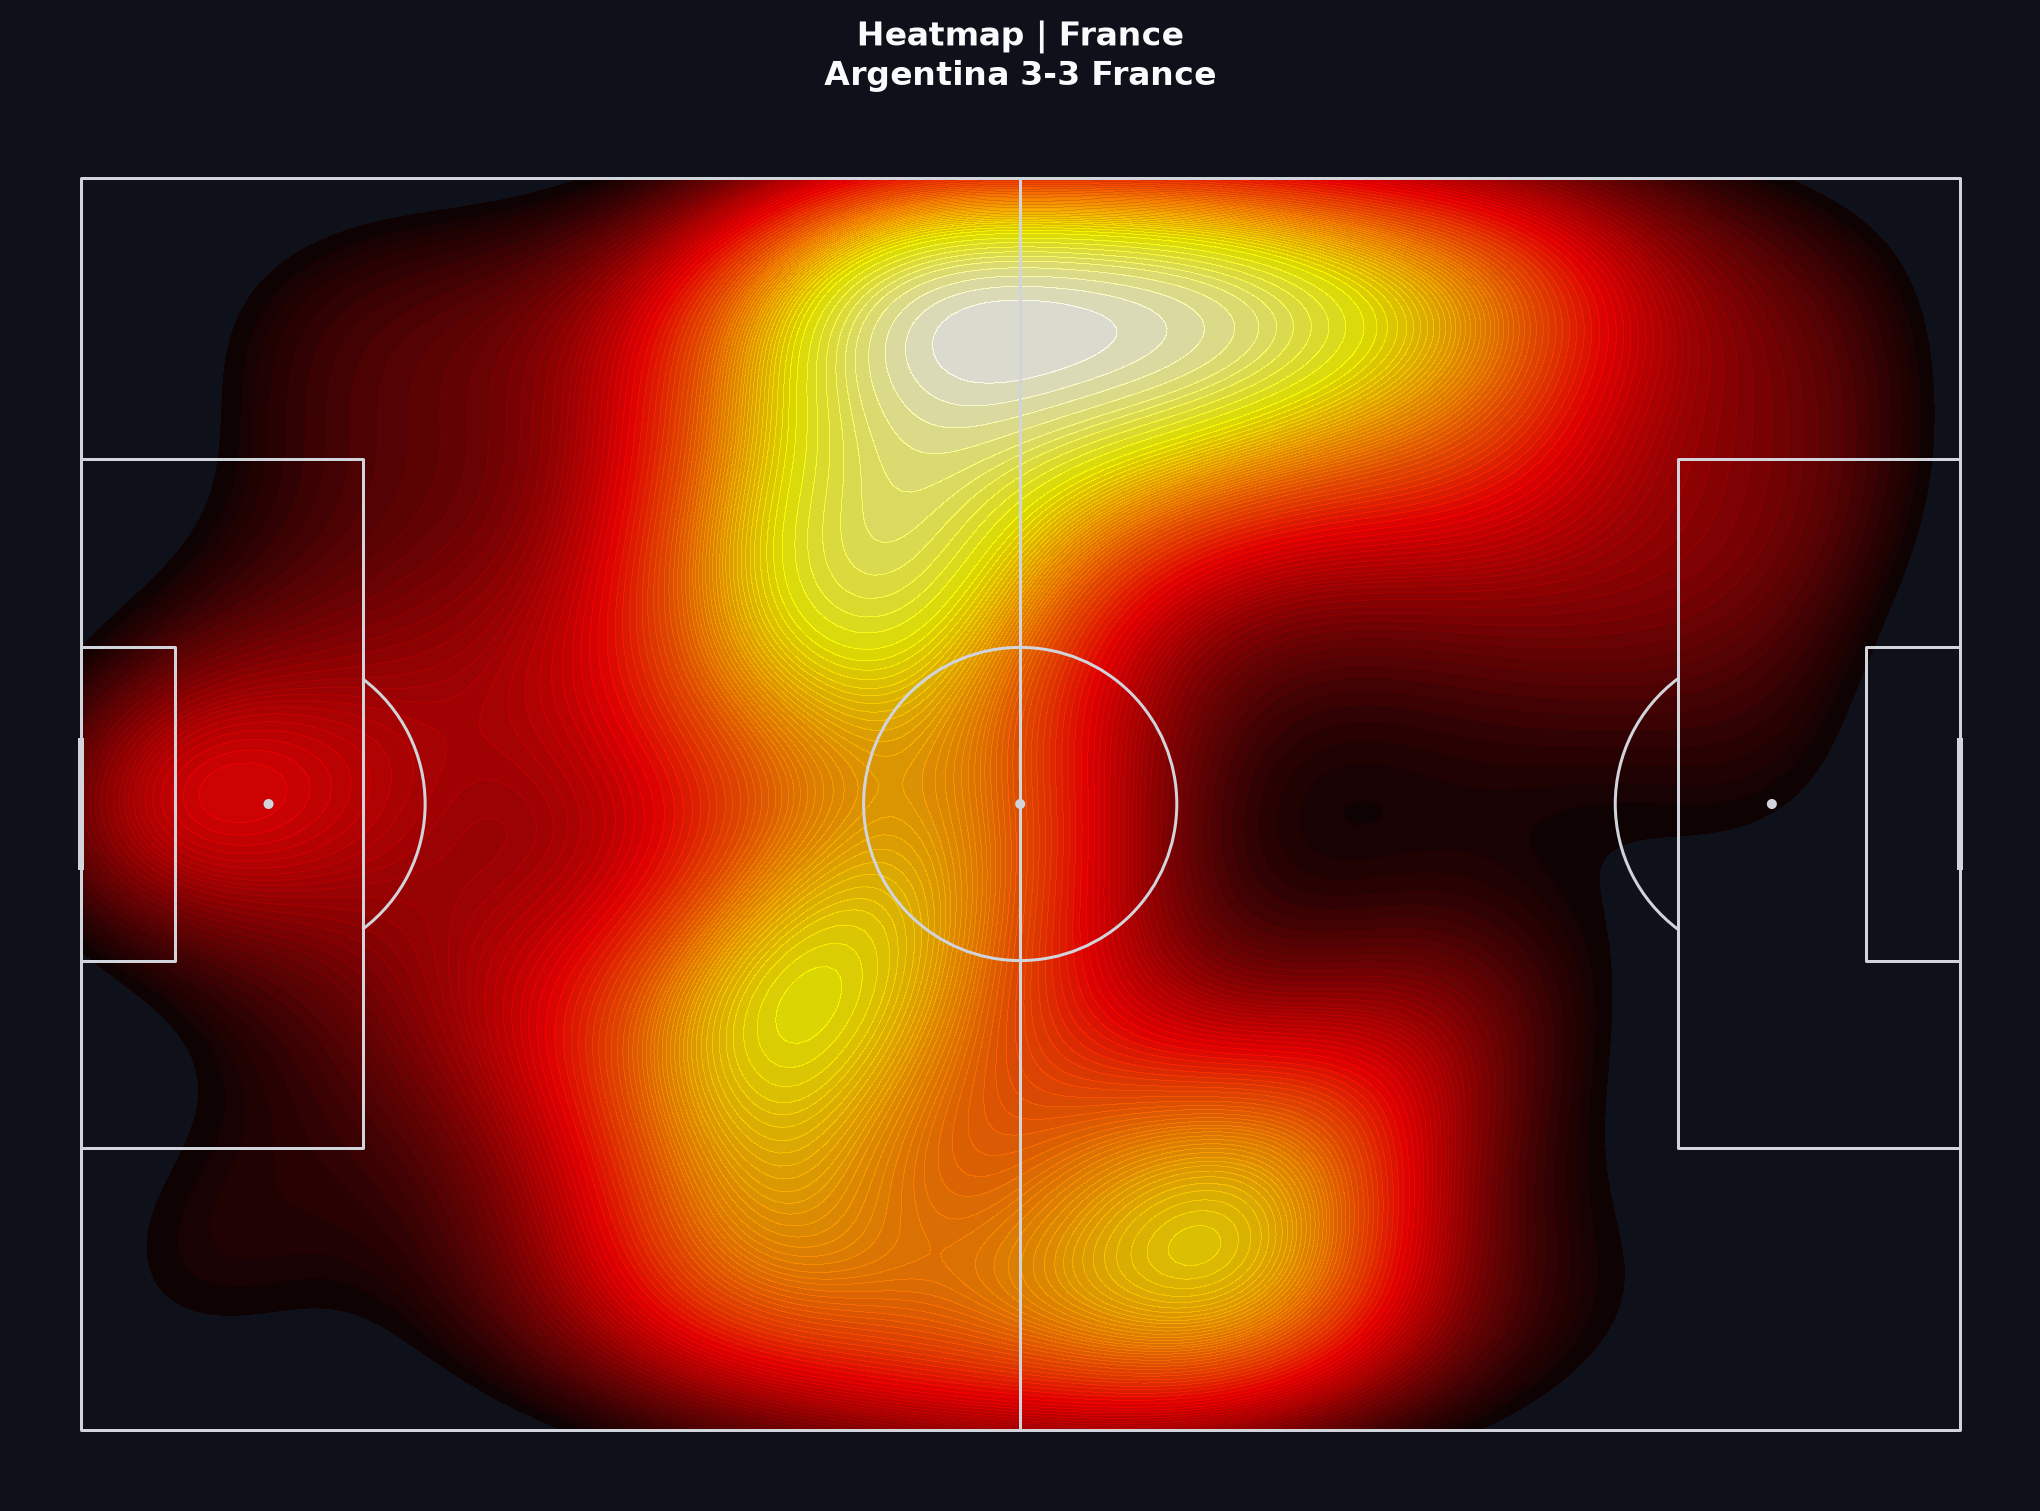
- Heatmaps (linked assets in the folder) show density of actions; average positions compress that density into one point per player. Use both ideas, not one alone.
دروس Learn ذات الصلة
جمع الخيوط
قسم الختام يبقى بالإنجليزية للدقة.
A responsible short report on this final would state the question (for example: how Argentina controlled progression before France’s late surge), show evidence by layer (network → progressive passes → shots), and keep the shoot-out analytically separate.
If you are following the Learn path, write five sentences using only claims these visuals can support — then note what still requires video.
مهمة تطبيقية
في 150–200 كلمة: (1) ادعاء واحد حول بناء الأرجنتين، (2) ادعاء واحد حول جودة أو توقيت فرص فرنسا، (3) حد من حدود بيانات الأحداث في هذه المباراة. اربط كل ادعاء بصورة من الأعلى.
Event data from StatsBomb’s public World Cup 2022 release. Coordinates use StatsBomb’s pitch model.