
Match-Labor / FIFA-Weltmeisterschaft 2022
Gruppenphase · 2022-11-23
Deutschland 1–2 Japan
Japan kam von hinten und gewann
Sheikh Khalifa International Stadium · StatsBomb Open Data
Titel und Zusammenfassungen sind übersetzt. Detaillierte Lesehilfen darunter bleiben auf Englisch — der Genauigkeit wegen.
Warum dieses Spiel zum Lernen nützlich ist
- Deutschlands Schuss- und Progressiv-Volumen wirken in Aggregaten dominant — Japan gewinnt trotzdem. Diese Spannung lehrt Prozess vs. Ergebnis ohne Verschwörungsnarrative.
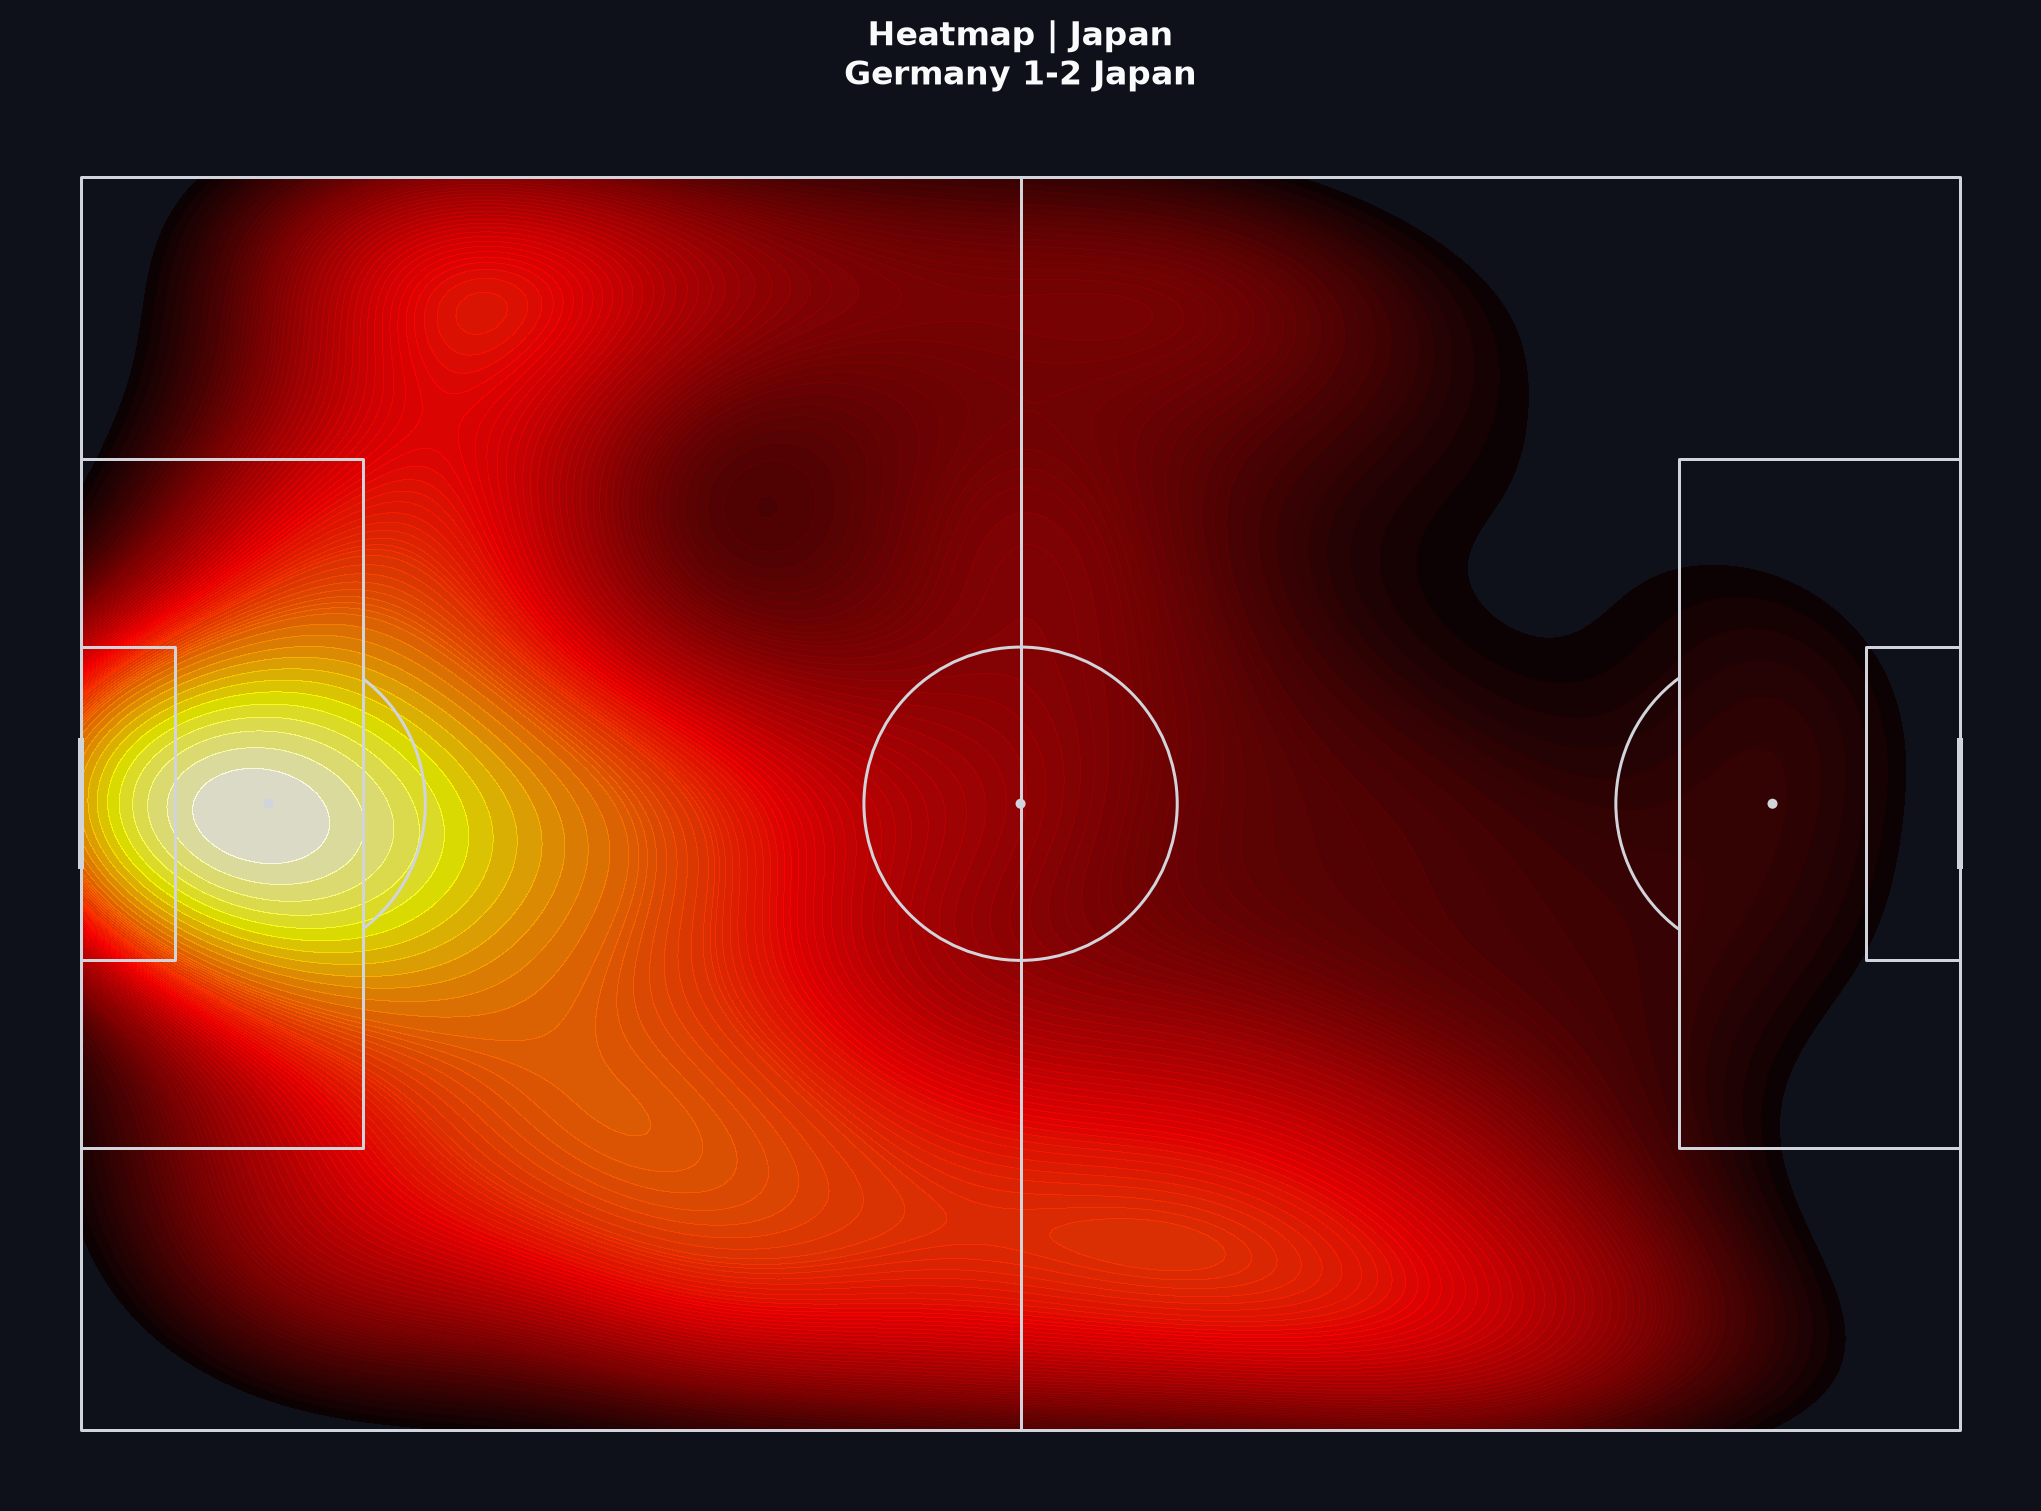
- Heatmaps und Durchschnittspositionen helfen zu fragen, wann territorialer Druck entstand — nicht nur wer über 90 Minuten mehr hatte.
- Japans progressiver Anteil an erfolgreichen Pässen ist bei deutlich kleinerer Pass-Stichprobe höher — ein Gegenmittel zum reinen Volumenlesen.
- Passt klar zu Learn-Lektionen über xG-Grenzen, Stichprobengröße und Interpretationsfehler nach überraschendem Ergebnis.
Spielkontext
Deutschland ging in Führung und erzeugte viele Schüsse. Japan glich aus und ging vor, gewann 2:1 — ein Ergebnis, das die Gruppe-E-Narrative über Nacht umschrieb.
Für den Unterricht: die vollen 90 Minuten sind eine laute Stichprobe. Starke Claims brauchen klaren Umfang (erste Halbzeit vs. Schlussphase) und Demut gegenüber Abschlussvarianz.
Perioden 1–2 (reguläre Spielzeit)
Die Zahlen unten decken die reguläre Spielzeit ab (Perioden 1–2). Ein-Spiel-xG-Vorsprünge bleiben rauschig — als Prozessdeskriptoren nutzen, nicht als Gerichtsurteil.
- Deutschland
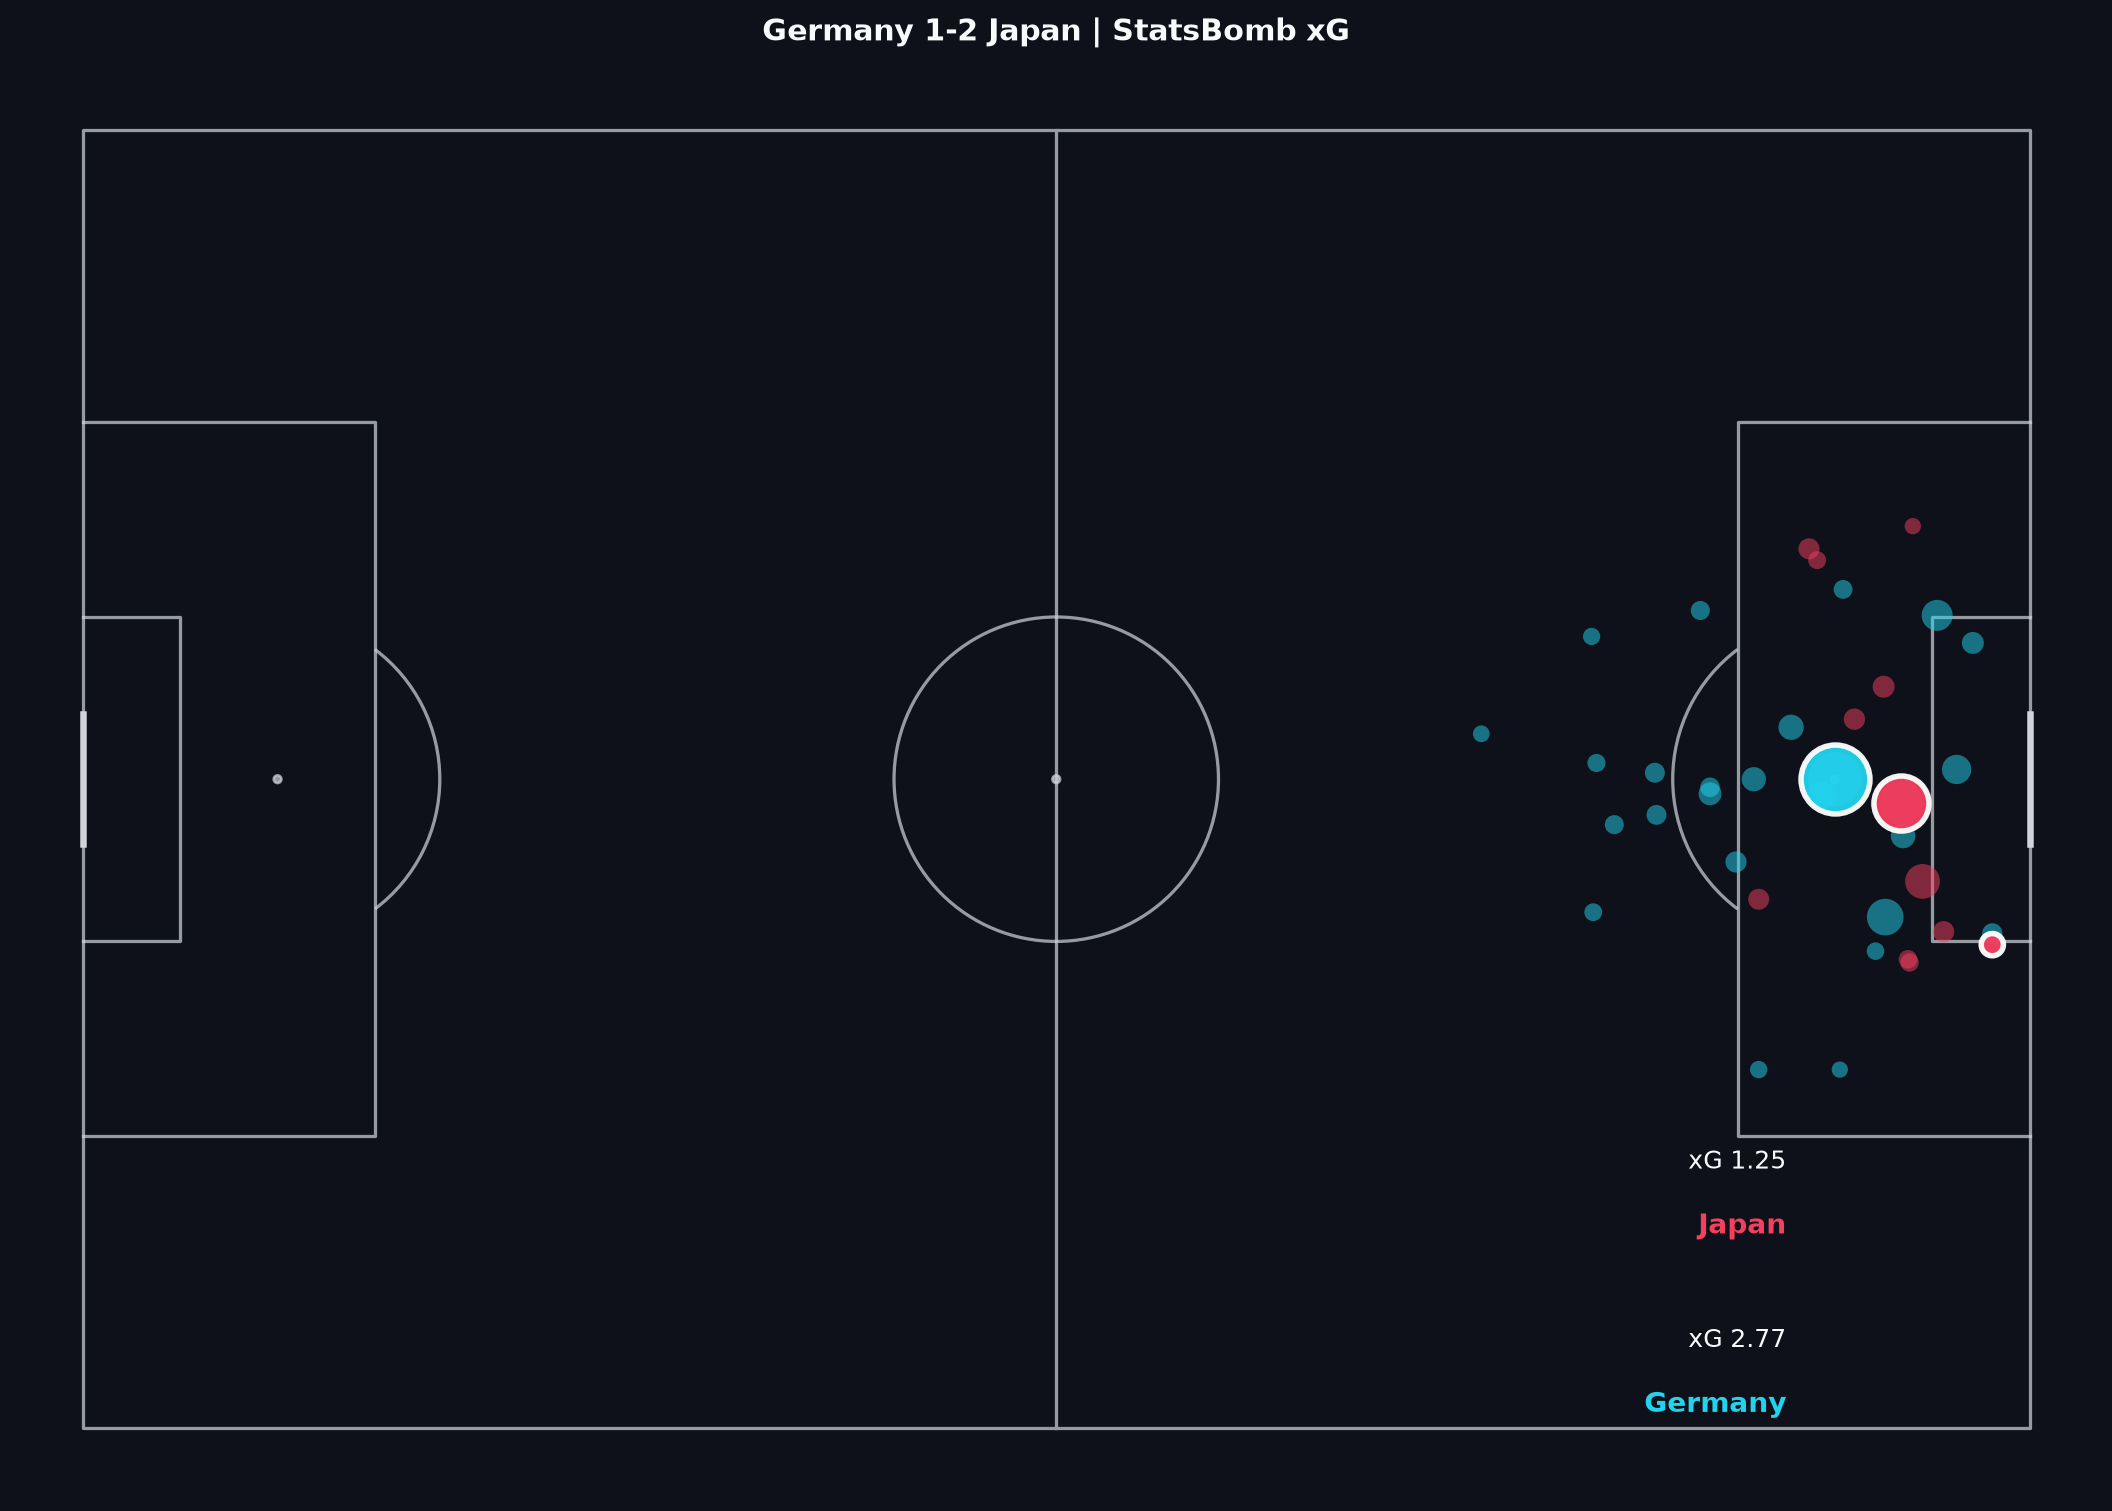
- 26 Schüsse · 1 Tore · ~2.77 xG
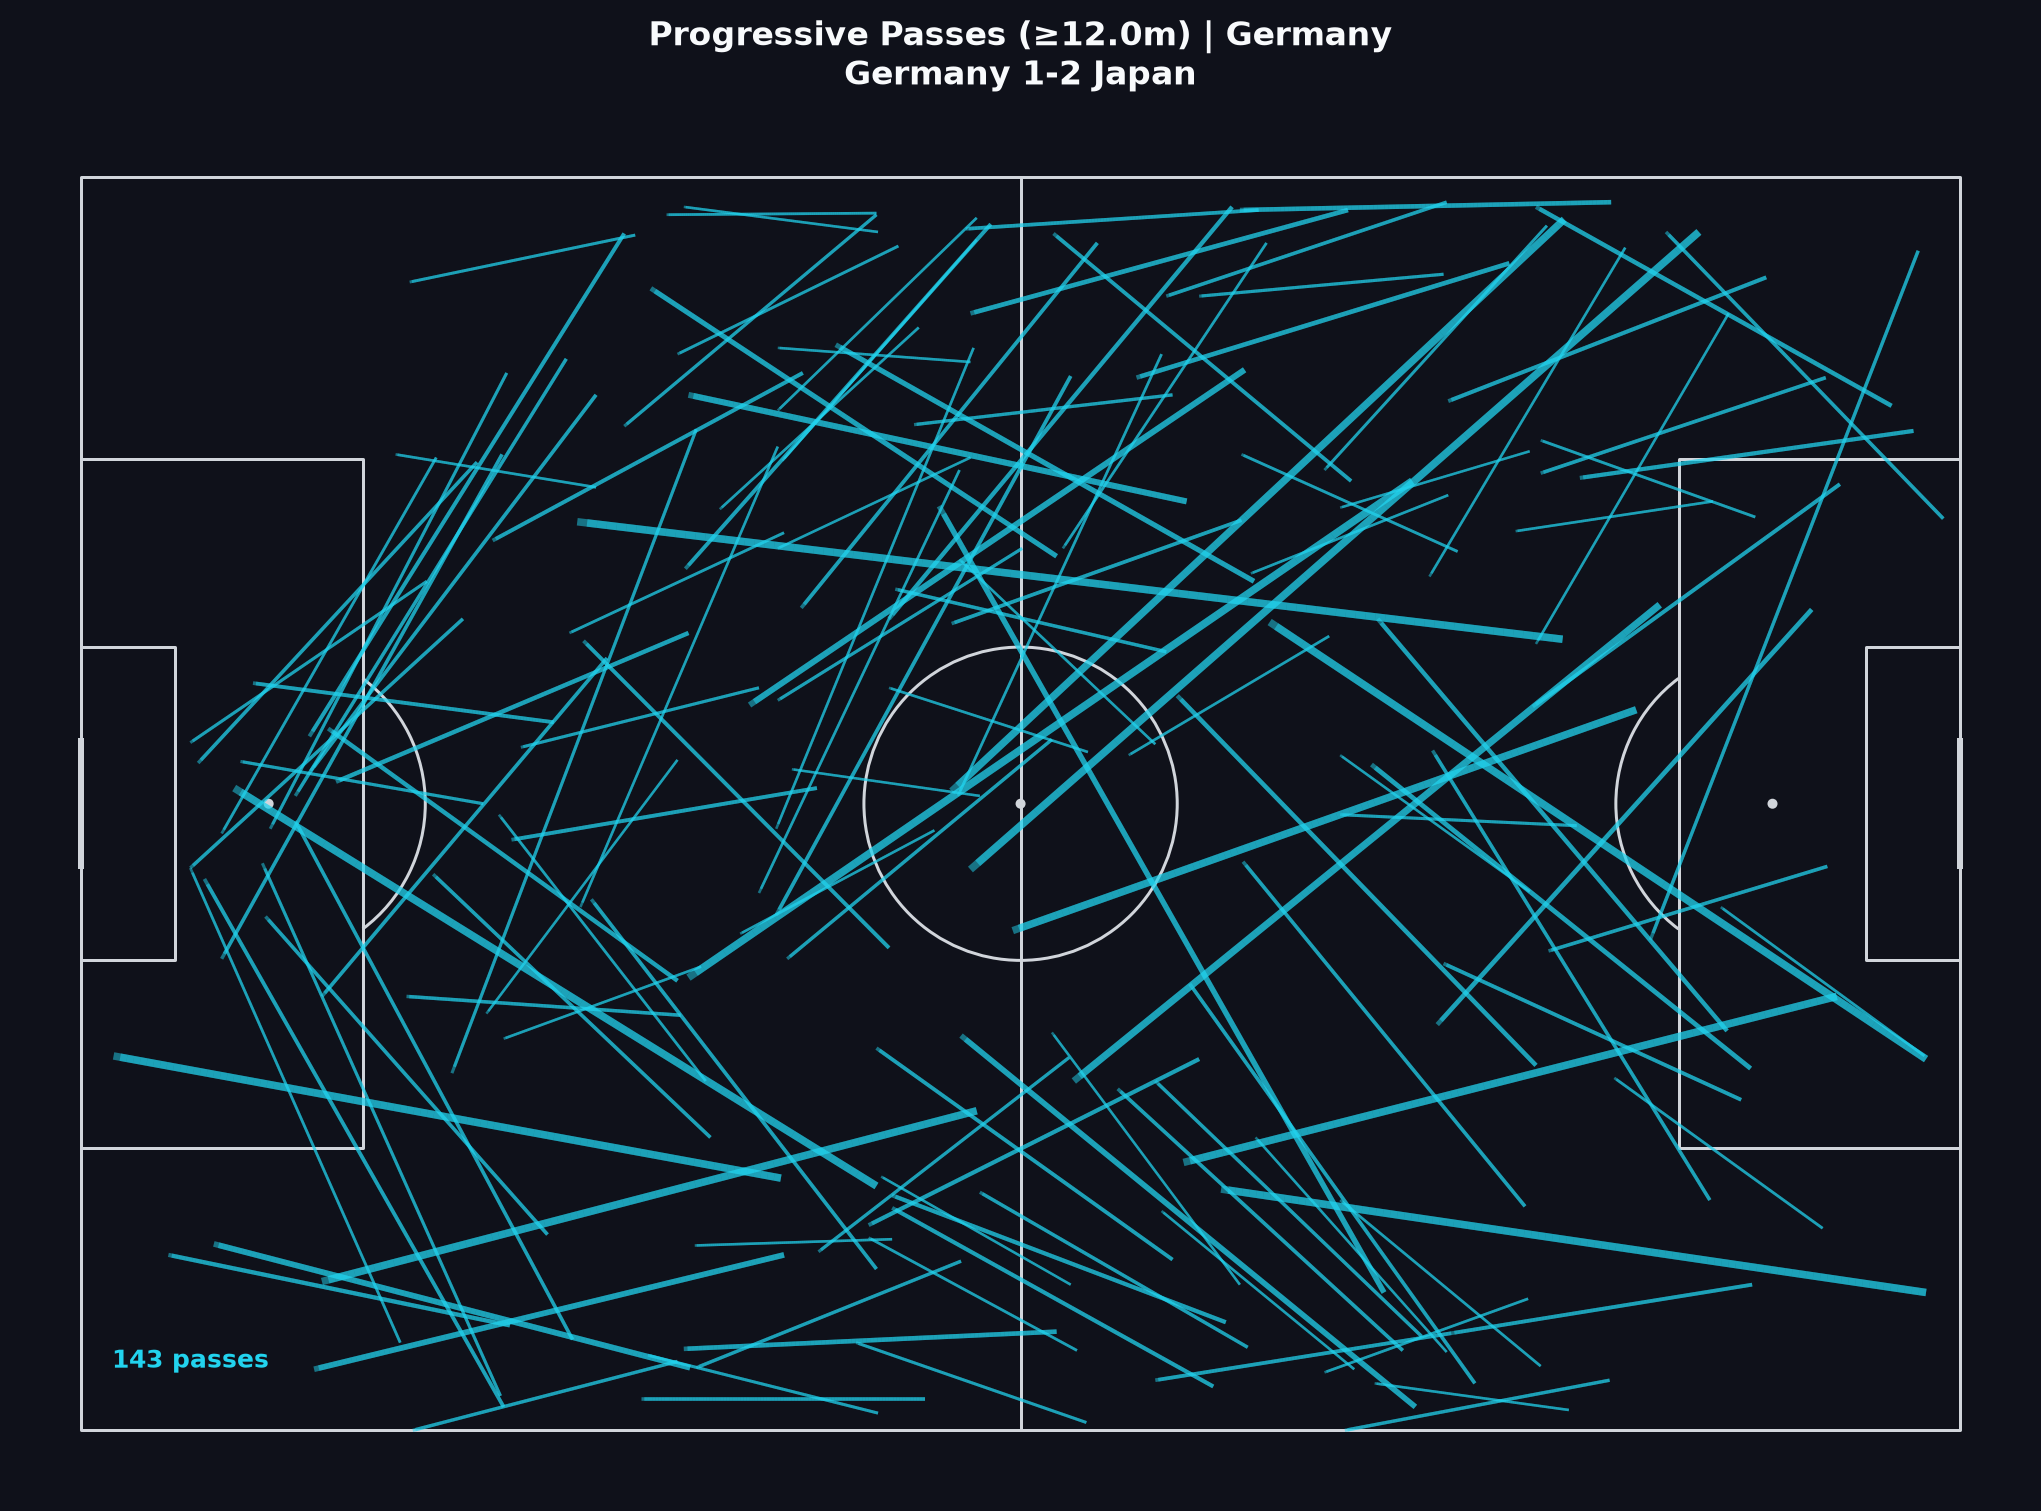
- Progressive Pässe: 143 (19.8% der Pässe)
- Japan
- 12 Schüsse · 2 Tore · ~1.25 xG
- Progressive Pässe: 60 (27.9% der Pässe)
Visual 1
Schusskarte
Deutsche Marker zeigen hohes Volumen (~26 Schüsse, ~2,8 xG) bei einem Tor; Japans weniger Versuche (~12 Schüsse, ~1,3 xG) bringen zwei Tore. Prozess und Ergebnis als verwandte, aber getrennte Ebenen lesen.
So liest du das
Die detaillierten „So liest du das“-Punkte sind auf Englisch.
- Compare volume and quality together. A large German xG total describes chance creation; it does not prove the scoreline was ‘stolen’ in a moral sense.
- Locate Japan’s goals in space and timing (video). Conversion from a smaller sample is common football variance — especially in single matches.
- Ask which German attempts are speculative from distance versus box chances. Not every marker carries equal historical goal probability.
- Resist rewriting the whole match from the final score. The map supports a process story; the scoreline is one realisation of that process.
Verwandte Learn-Lektionen
Visual 2
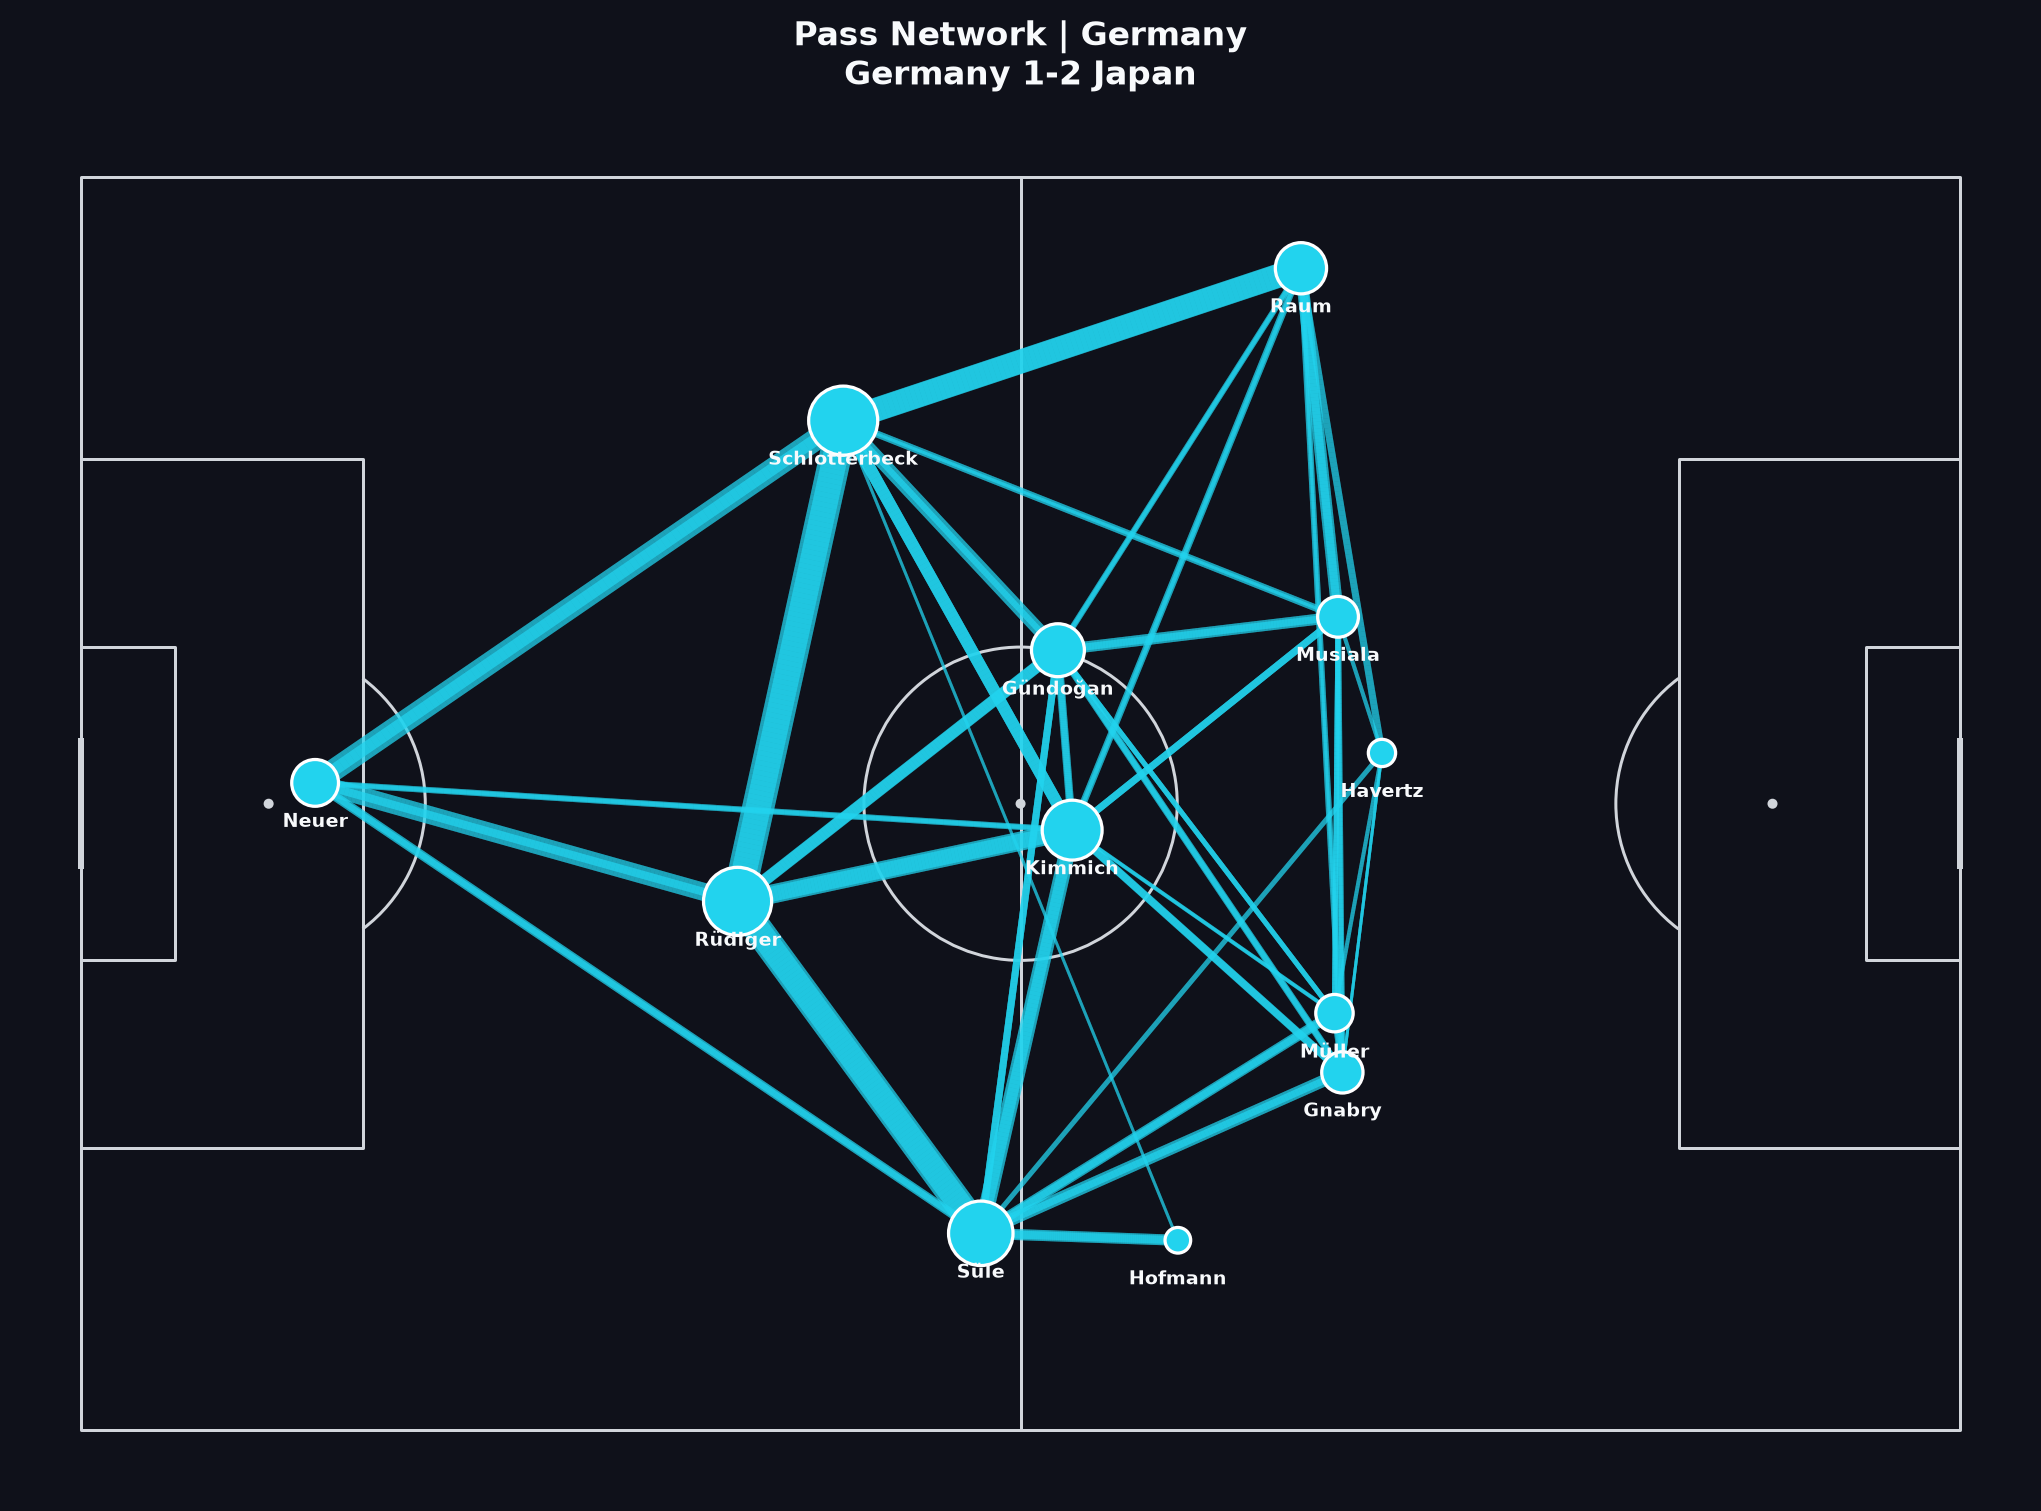
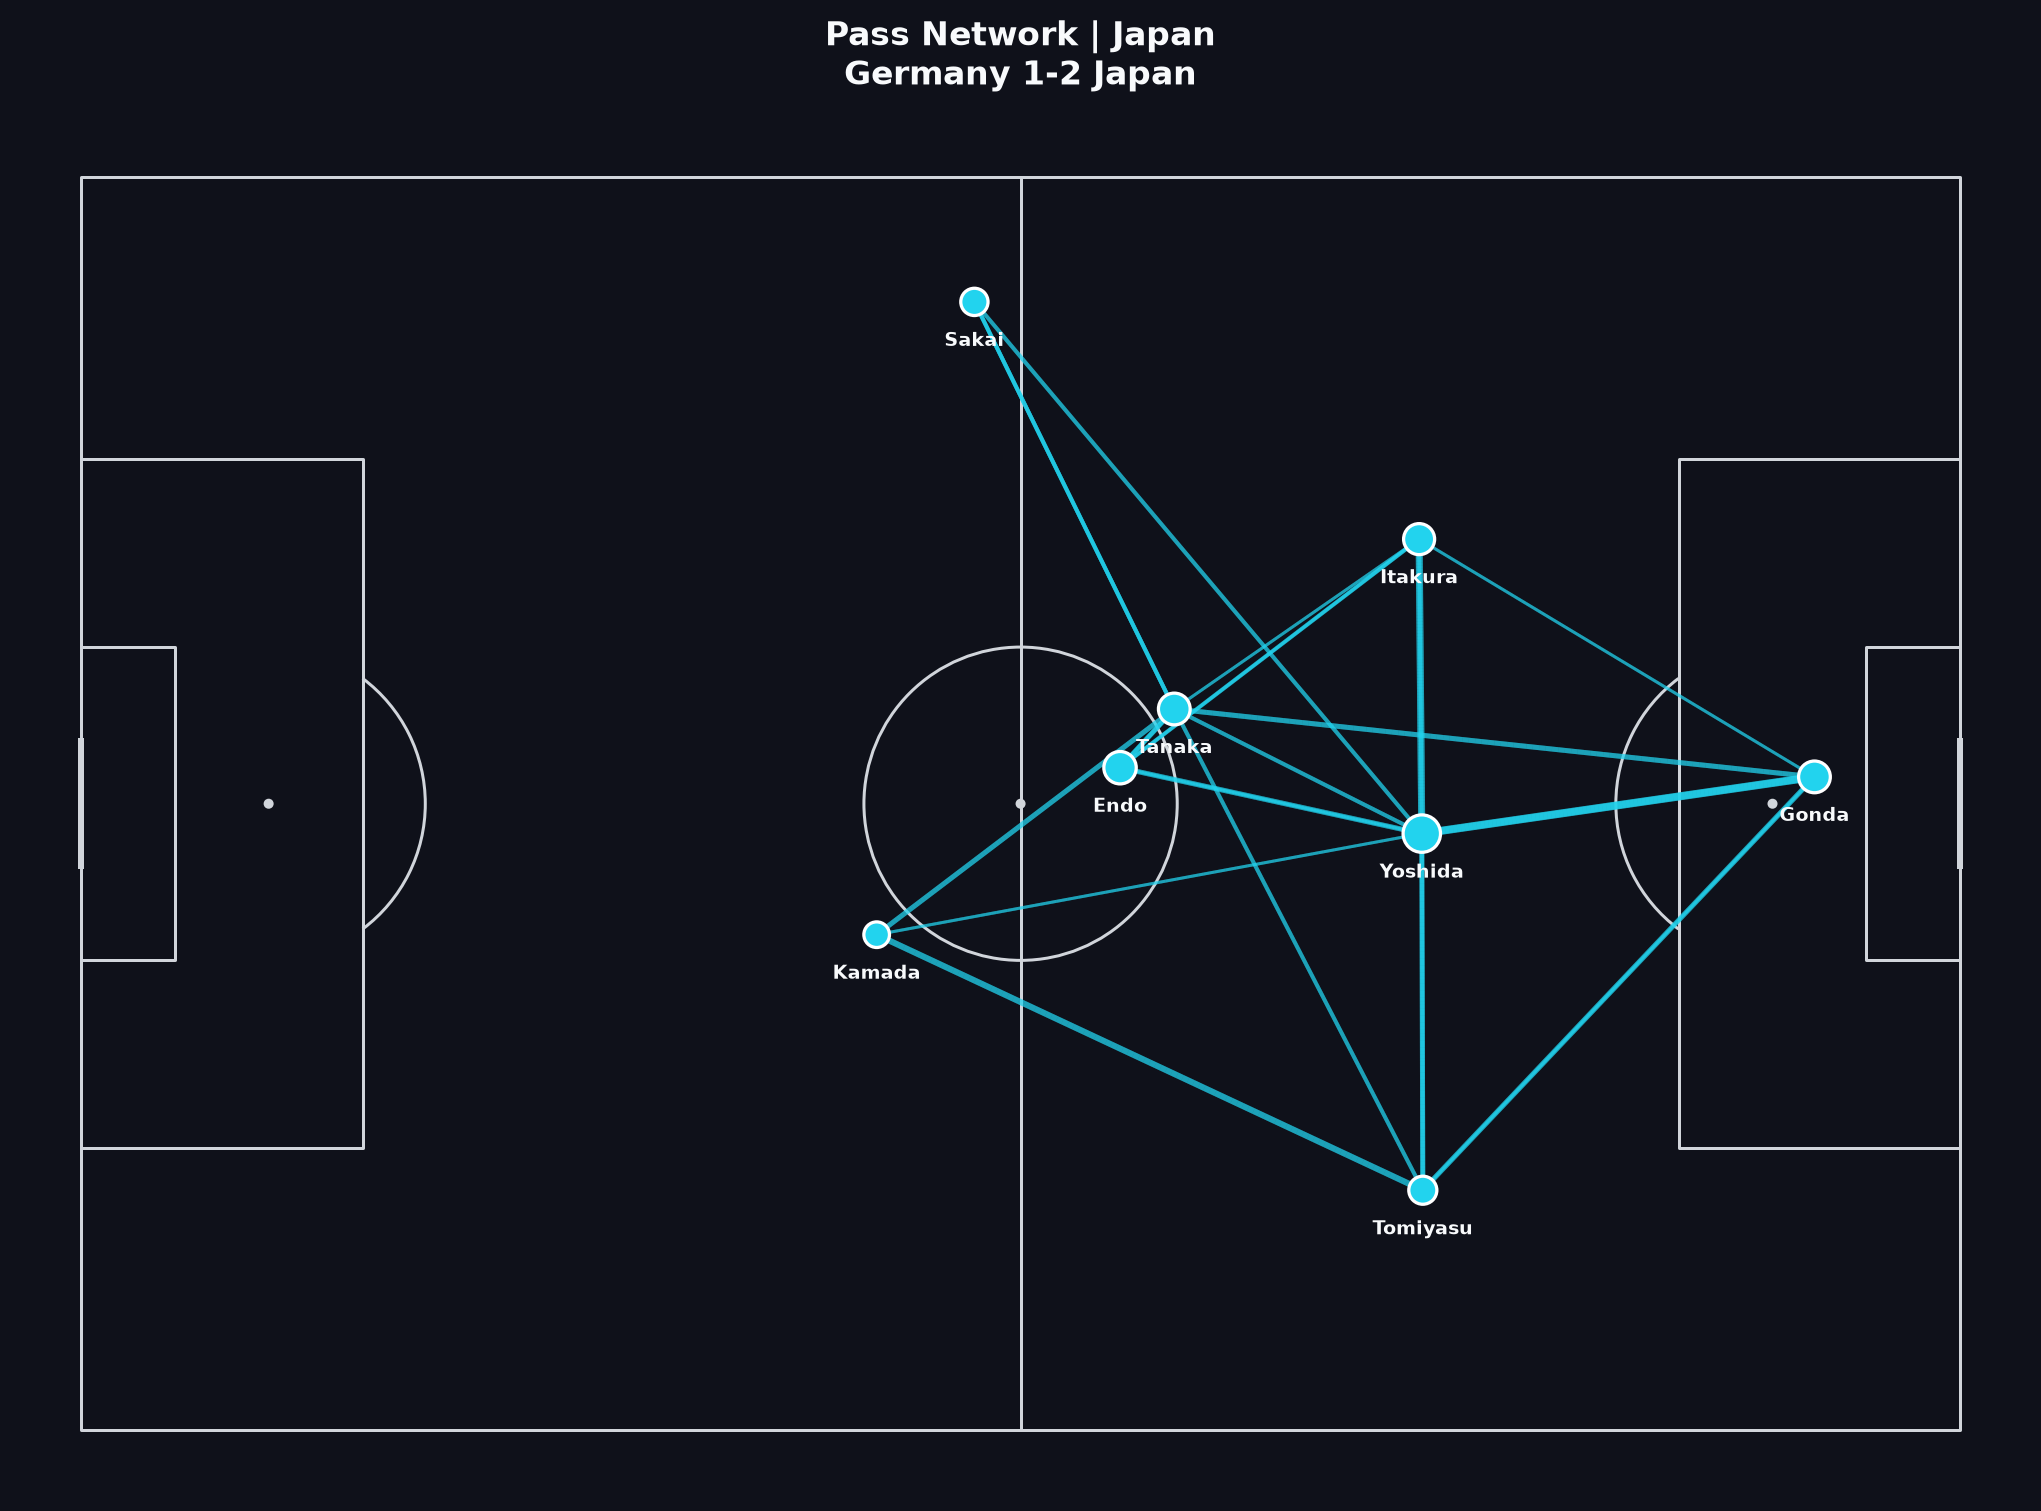
Passnetzwerk
Deutschlands dichteres Netzwerk spiegelt höheres Ballvolumen; Japans leichteres Graph kann trotzdem gefährliche Transitionen tragen. Dichte ist keine Überlegenheit.
So liest du das
Die detaillierten „So liest du das“-Punkte sind auf Englisch.
- Identify German hubs between build-up and the final third. Frequent combinations explain territorial pressure more than they explain finishing.
- Japan’s thinner network may hide effective vertical connections after recoveries — confirm with progressive passes and video.
- Game state matters: a team protecting a lead or chasing a deficit changes who combines where.
- Use the network as a hypothesis generator for structure, not as a full tactical film.
Verwandte Learn-Lektionen
Visual 3
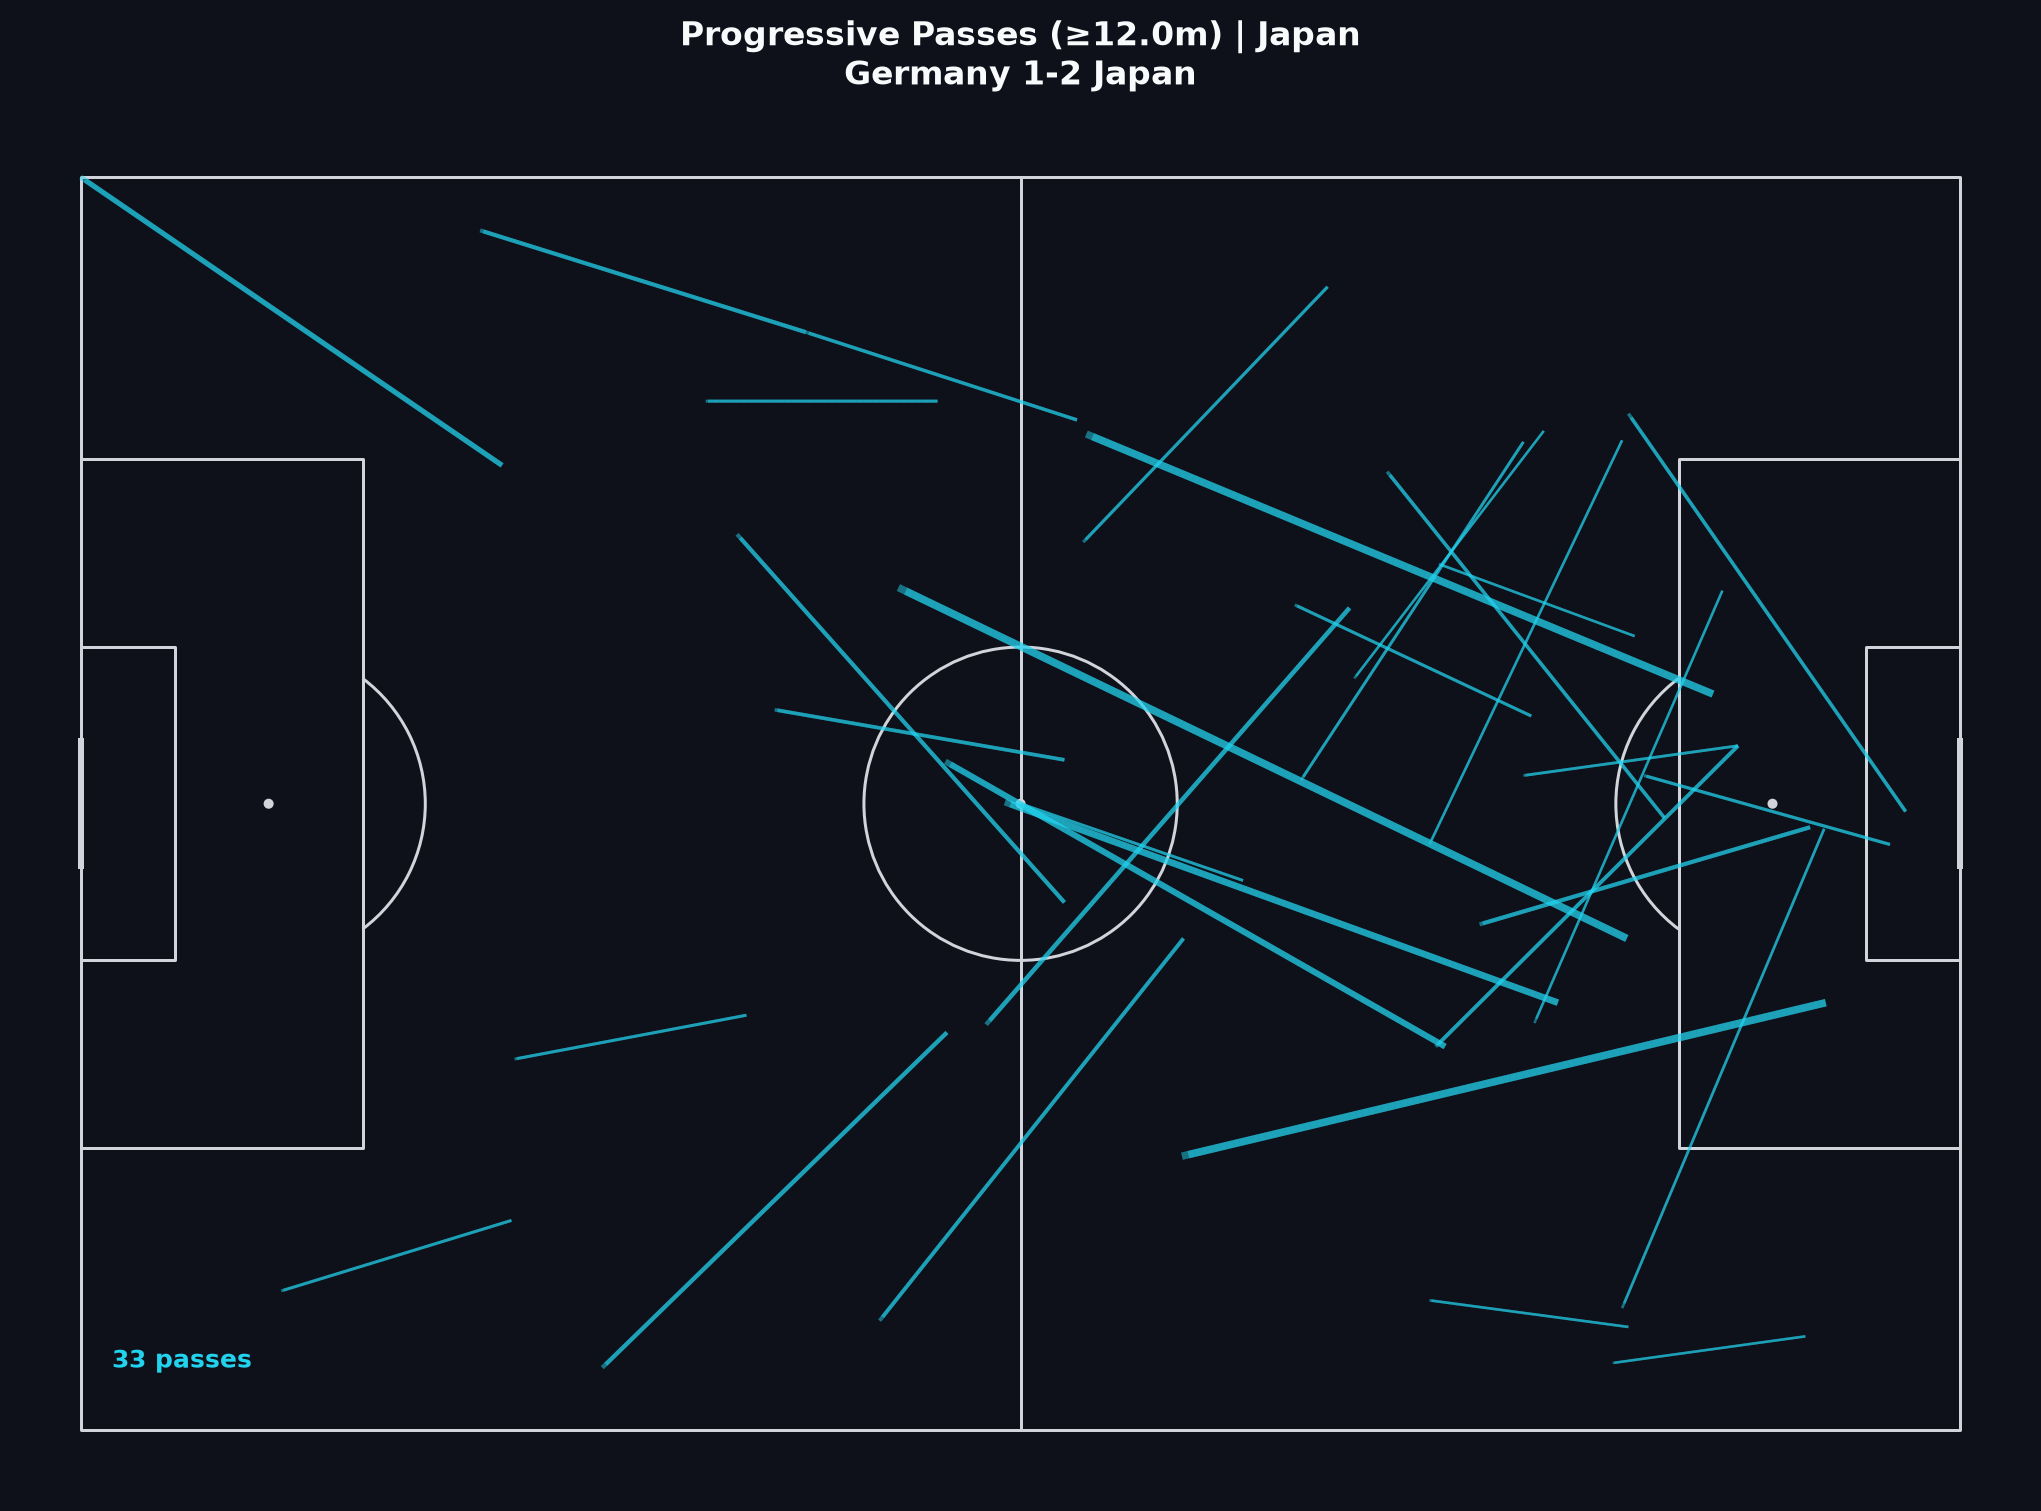
Progressive Pässe
Deutschland progressiert absolut häufiger (~143 vs. ~60). Japans progressiver Anteil an erfolgreichen Pässen ist höher (~28 % vs. ~20 %) bei weniger Pässen — Kontrolle von Effizienz der Fortbewegung trennen.
So liest du das
Die detaillierten „So liest du das“-Punkte sind auf Englisch.
- Absolute progressive volume tracks who advanced the ball more often; progressive share tracks how often completed passes gained territory.
- Pair with the shot map: German progression feeding many shots is a coherent process story even when conversion disappoints.
- Ask where progressions end. Entries into the box differ from sideways gains near halfway.
- Avoid ranking teams by one progressive number after a surprising scoreline — state the metric and the sample.
Verwandte Learn-Lektionen
Visual 4
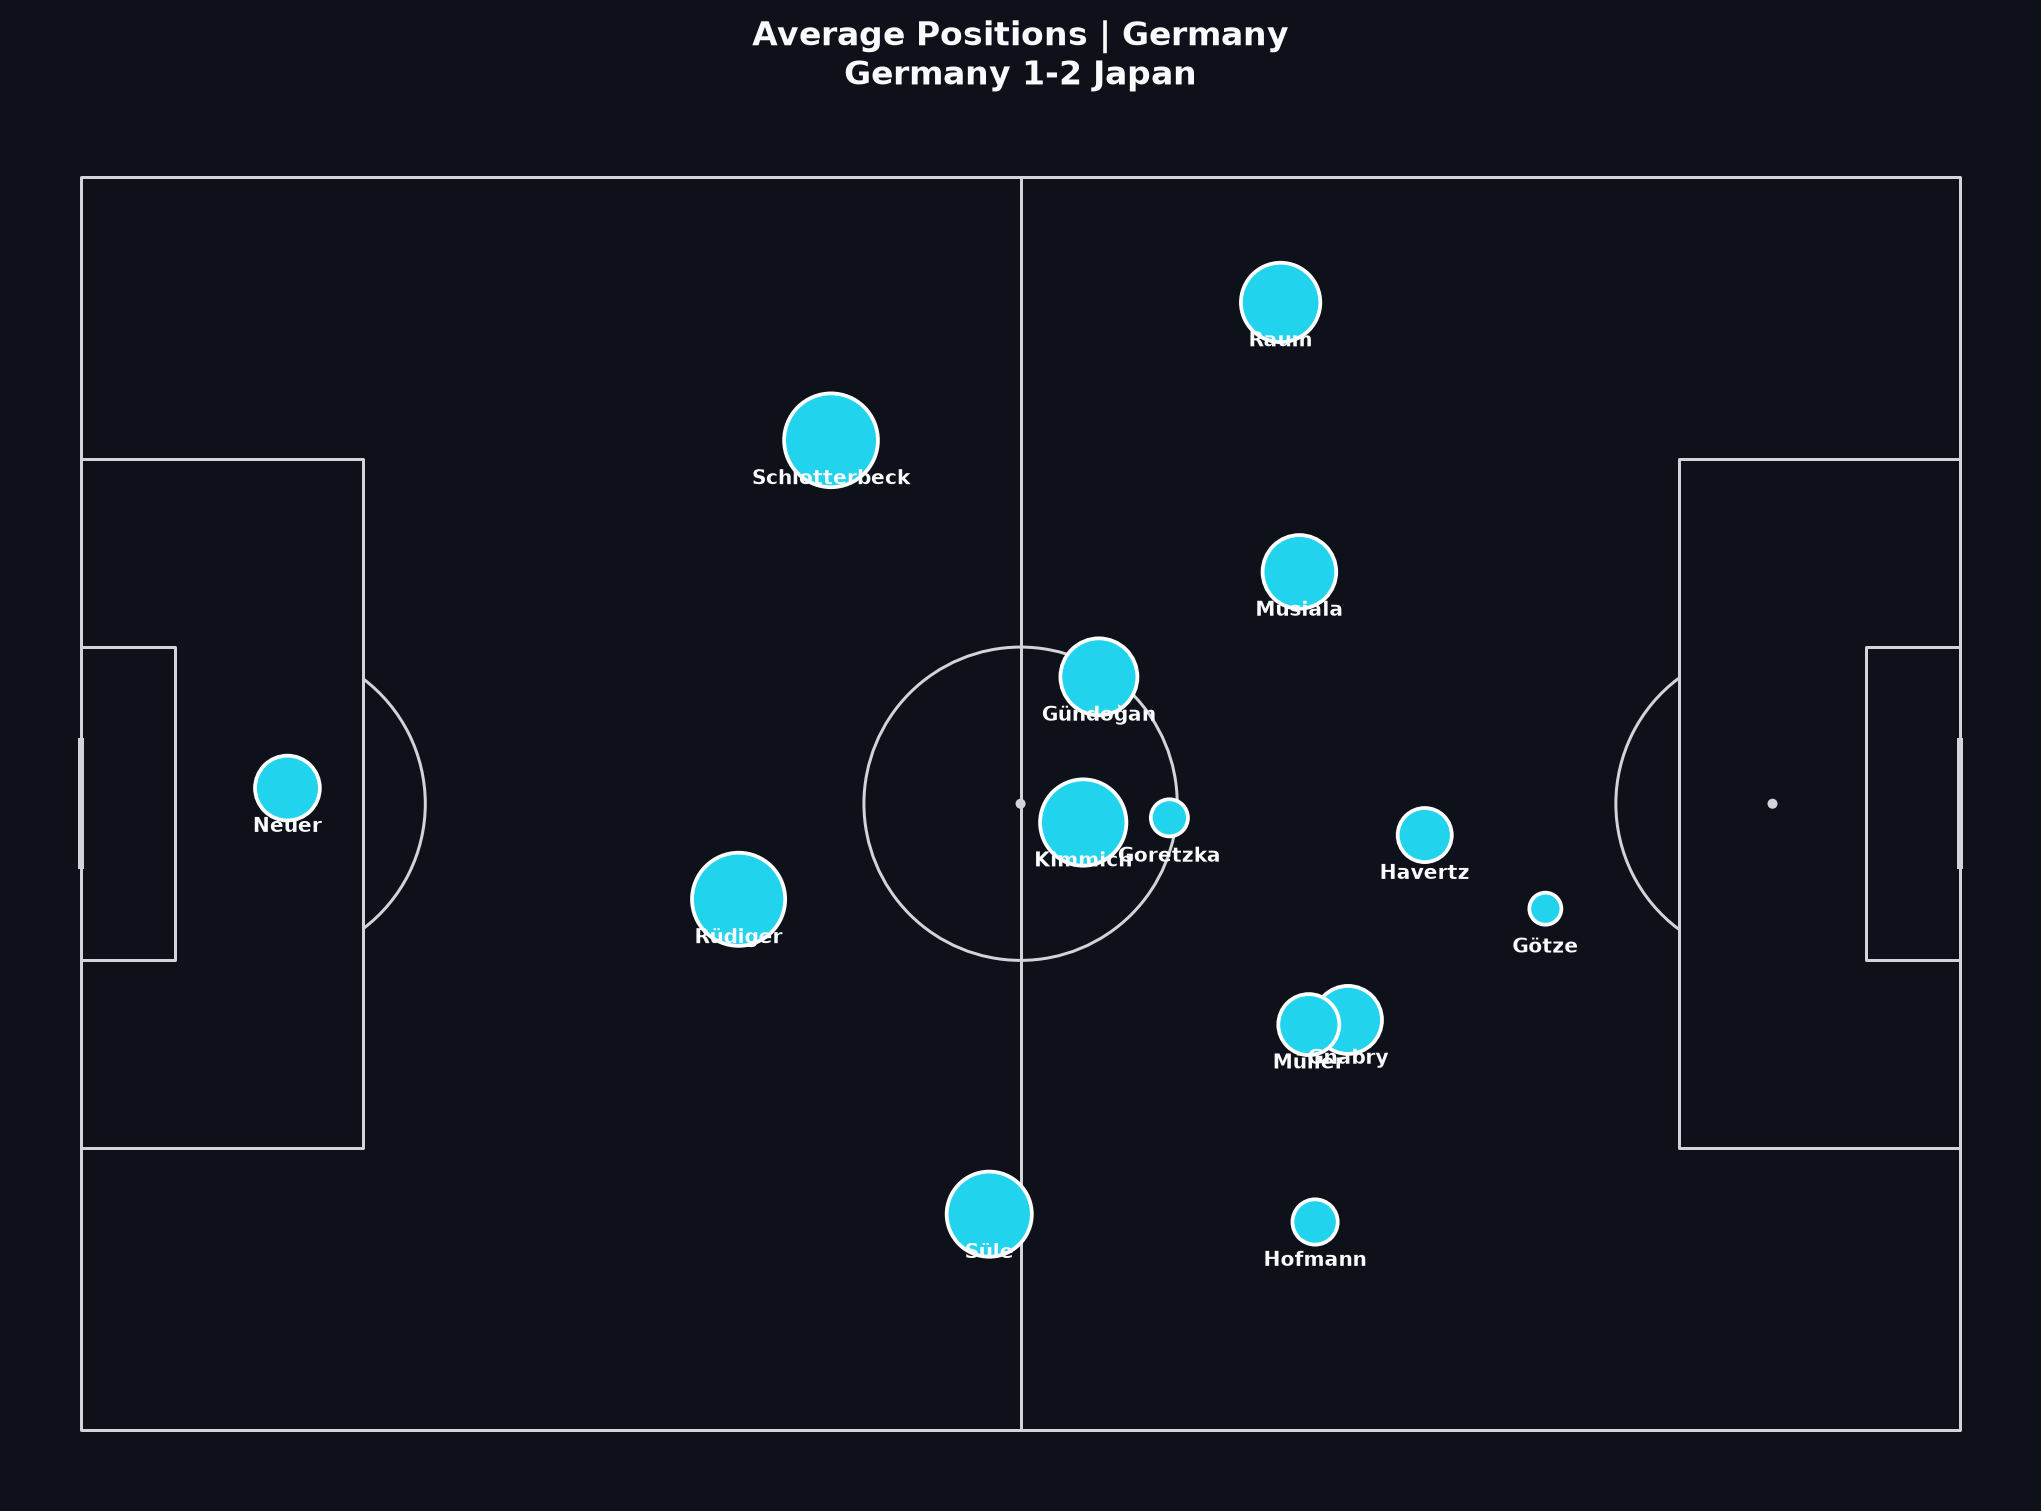
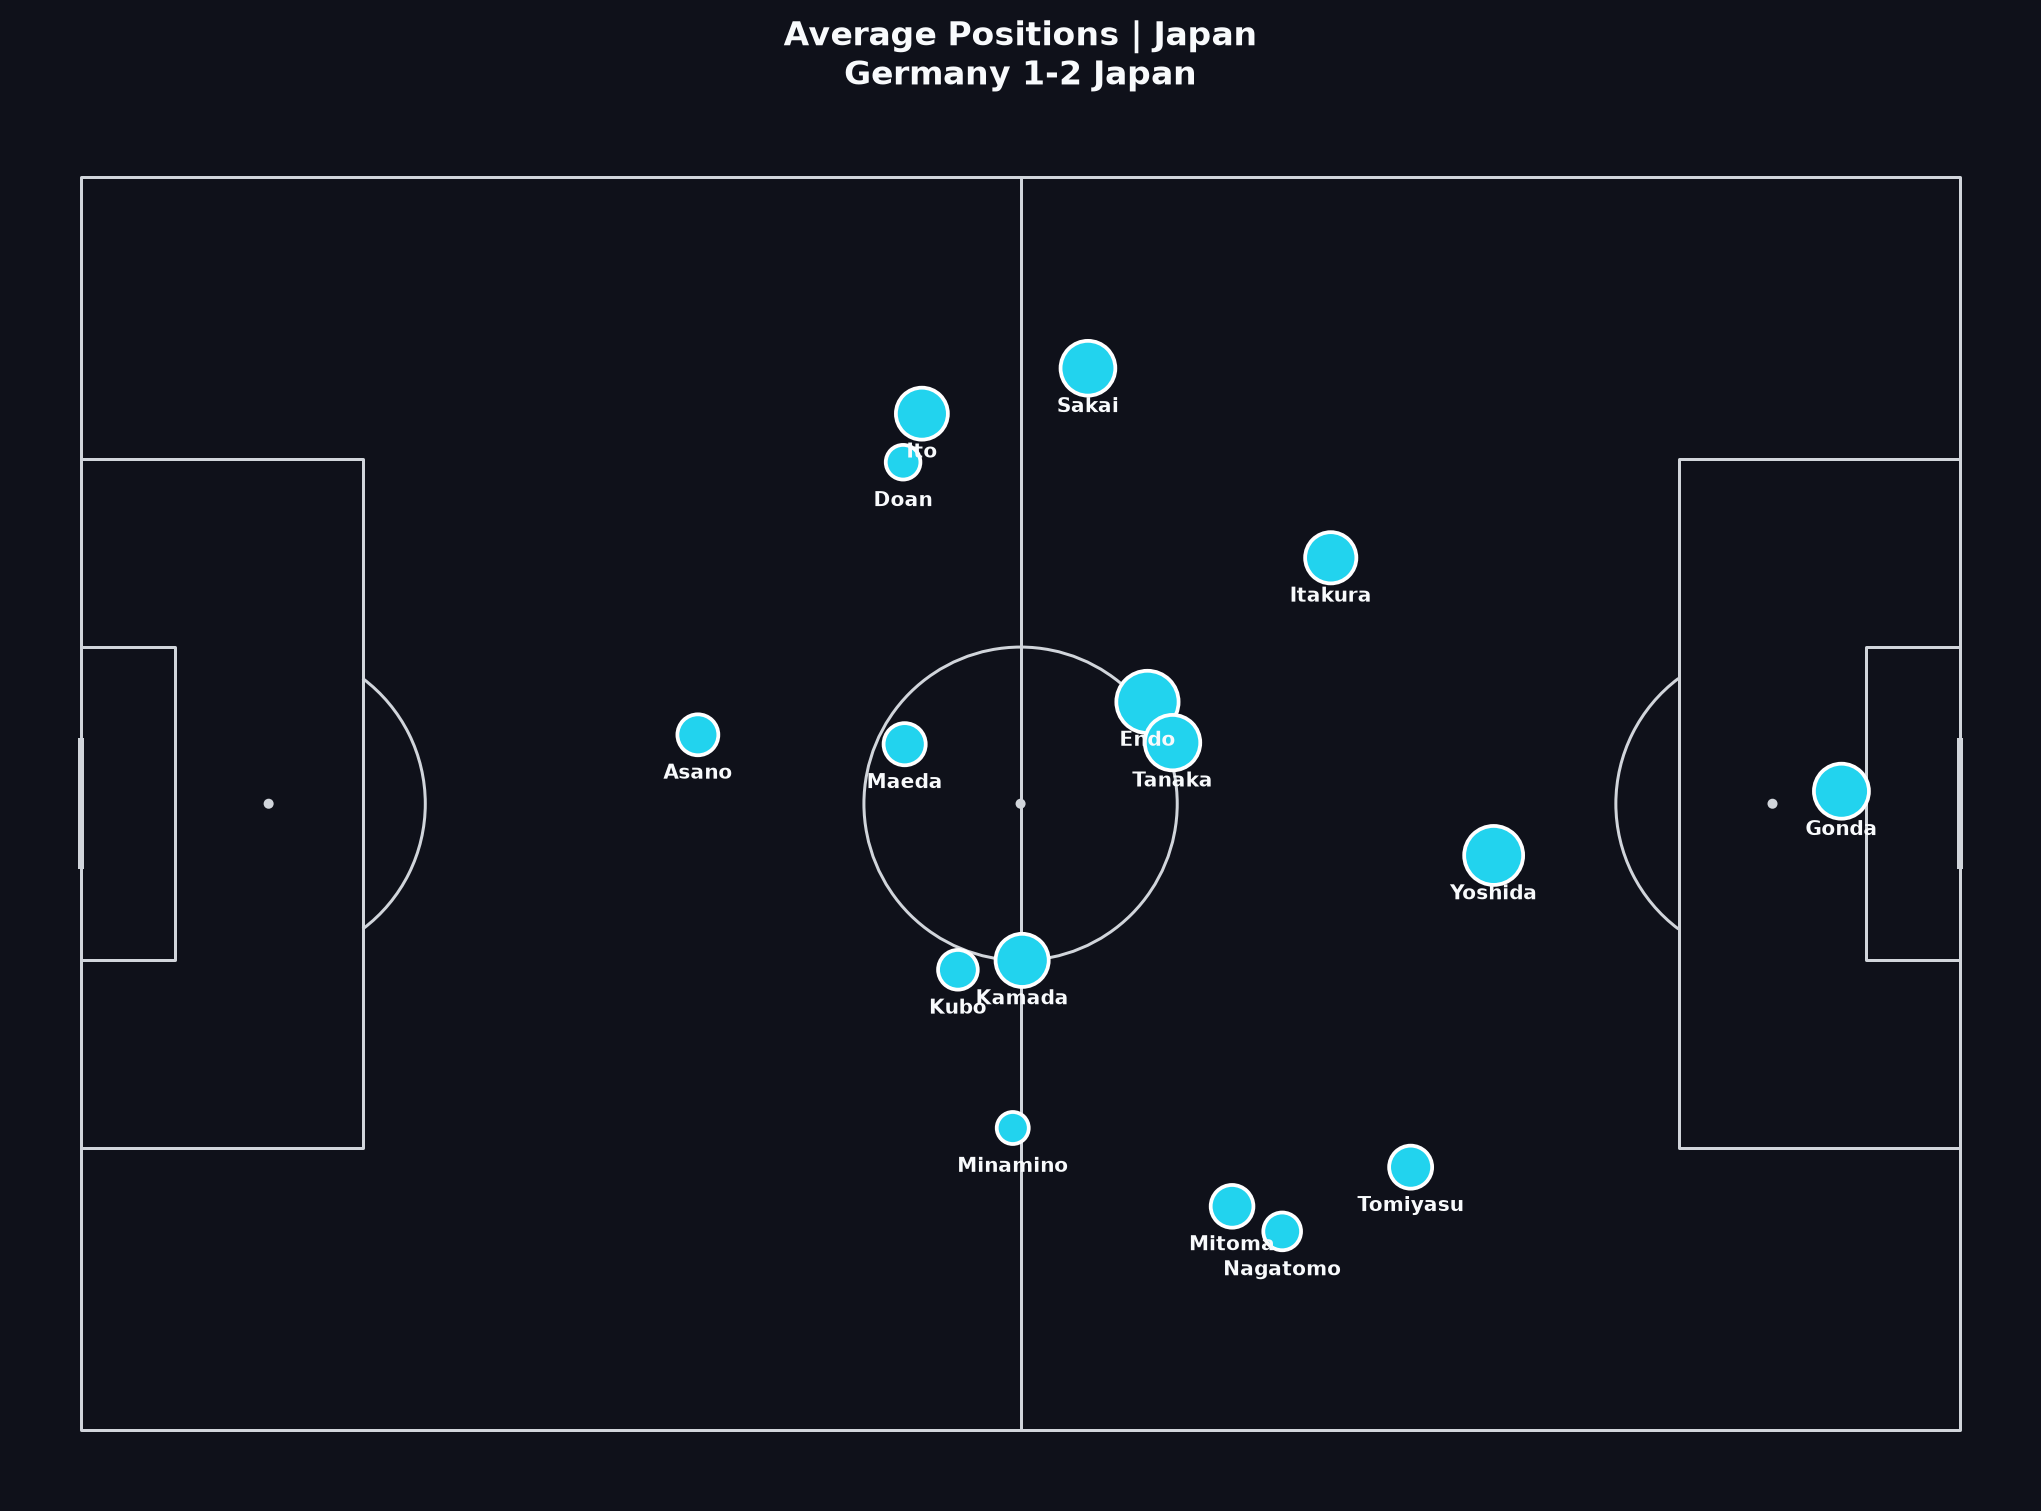
Durchschnittliche Positionen
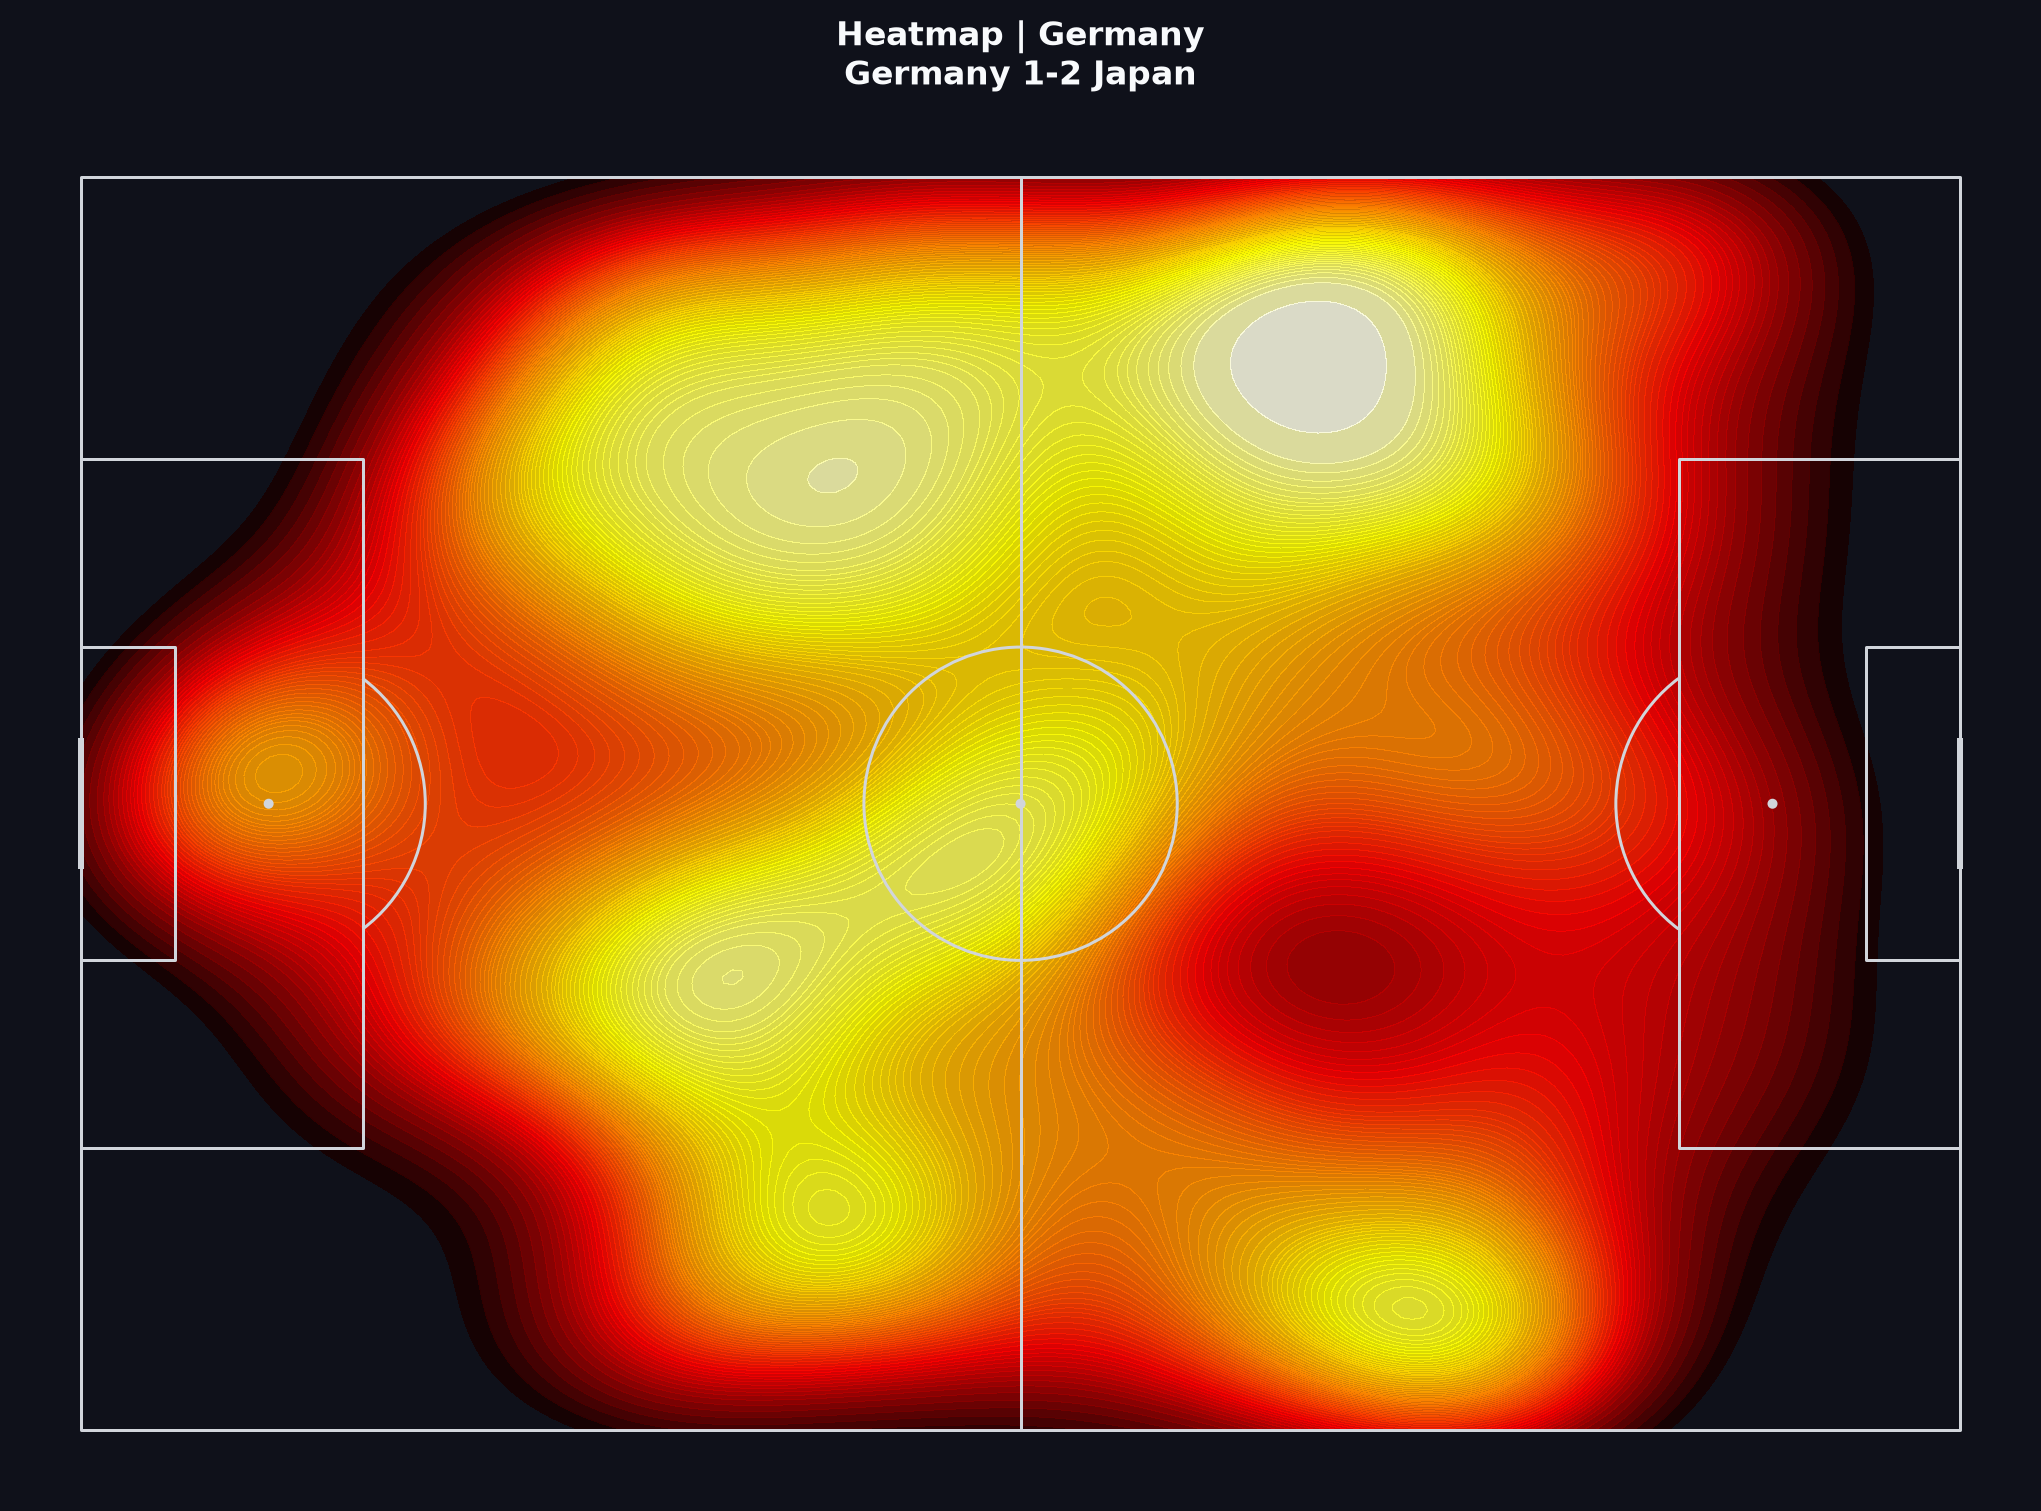
Durchschnitte verdichten 90 Minuten wechselnder Zustände. Mit Heatmaps fragen, wo Druck lag — besonders nach Japans Ausgleich.
So liest du das
Die detaillierten „So liest du das“-Punkte sind auf Englisch.
- German averages often sit higher when they dominate territory; Japanese averages may look deeper early and shift with match state.
- Heatmaps (below) show density piles that a single average point can hide — especially for wide attackers or late substitutes.
- Do not treat average positions as chalkboard formations. They summarise involvement locations, not every defensive shape.
- Form a question about pressing height or rest-defence, then verify on video before strong claims.
Verwandte Learn-Lektionen
Zusammenführen
Der Schlussteil bleibt der Präzision wegen auf Englisch.
A responsible short report would separate Germany’s chance-creation process from Japan’s conversion, state that single-match xG is noisy, and avoid claiming the visuals prove a ‘robbery’ narrative.
If you are following the Learn path, write five sentences using only claims these visuals can support — then note what still requires video and match-state timestamps.
Übungsauftrag
In 150–200 Wörtern: (1) eine Prozess-Aussage zu deutschem Schussvolumen oder Progression, (2) eine Aussage zu Japans Effizienz oder territorialer Form, (3) eine Stichproben-/Spielstand-Grenze. Jede Aussage an ein Visual oben knüpfen.
Event data from StatsBomb’s public World Cup 2022 release. Coordinates use StatsBomb’s pitch model.