
Laboratorio de partidos / Copa Mundial de la FIFA 2022
Fase de grupos · 2022-11-23
Alemania 1–2 Japón
Japón remontó
Sheikh Khalifa International Stadium · StatsBomb Open Data
Títulos y resúmenes están localizados. Las guías detalladas de lectura siguen en inglés por precisión.
Por qué este partido es útil para aprender
- Germany’s shot and progressive volume look dominant in full-match aggregates — yet Japan win. That tension teaches process versus outcome without conspiracy narratives.
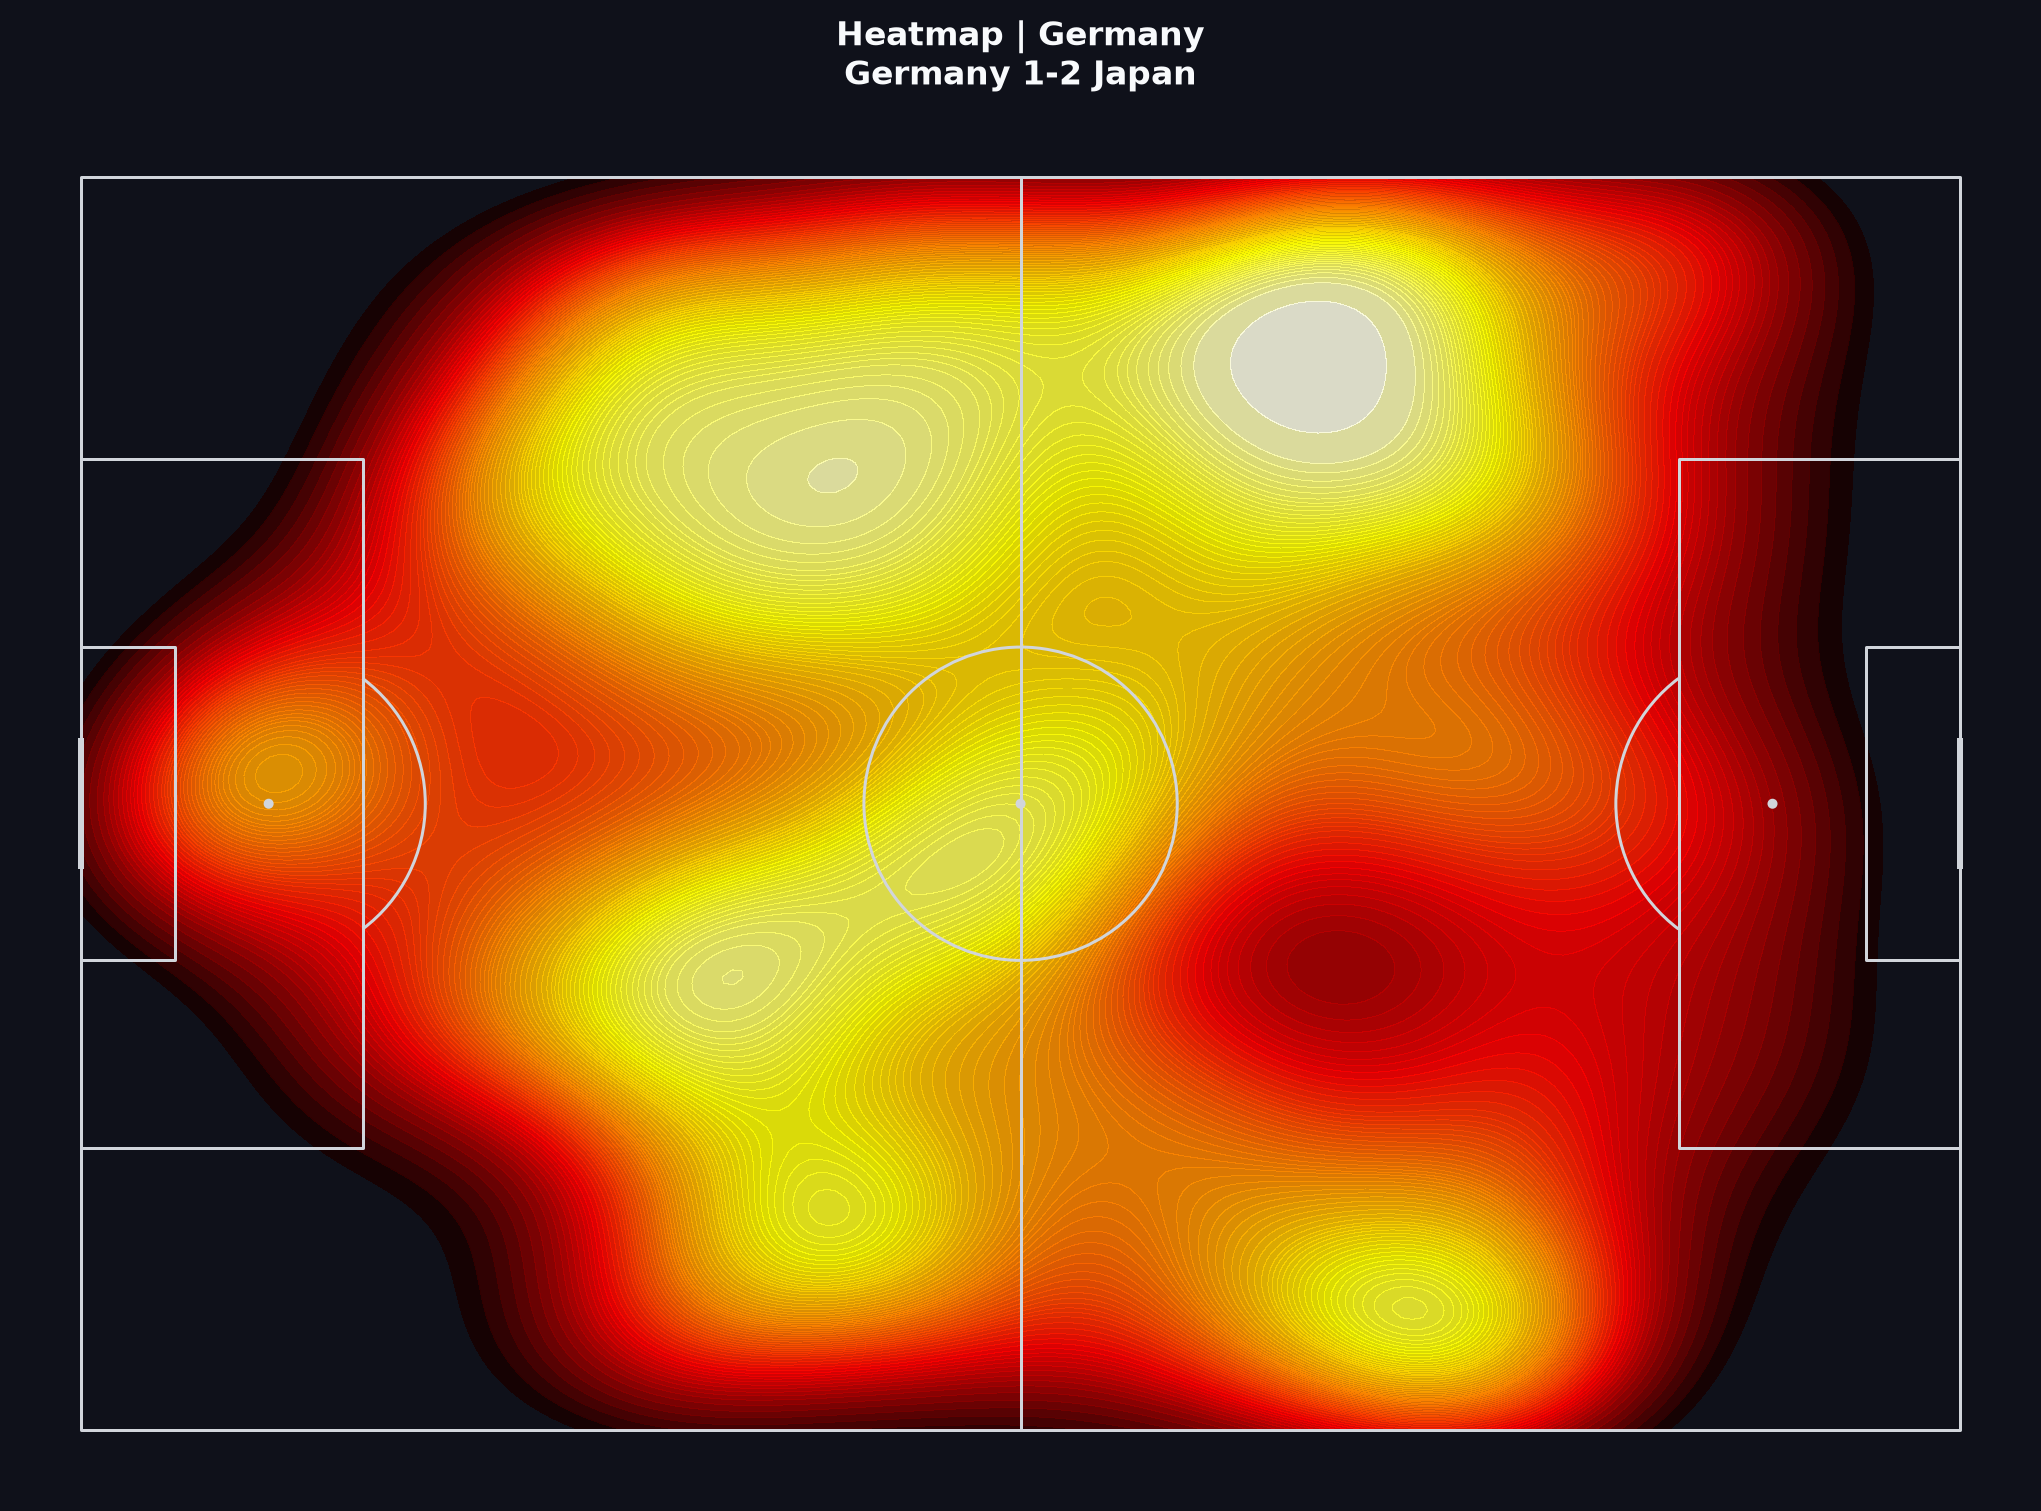
- Heatmaps and average positions help learners ask when territorial pressure occurred, not only who ‘had more’ across ninety minutes.
- Japan’s progressive share of completed passes is higher on a much smaller pass sample — a useful counter to reading absolute volume alone.
- It pairs cleanly with Learn lessons on xG limits, sample size, and common interpretation mistakes after a surprising scoreline.
Contexto del partido
Germany scored first and created a large volume of shots. Japan equalised and then took the lead, finishing 2–1 winners in a result that reshaped Group E narratives overnight.
For teaching, treat the full ninety minutes as one noisy sample. Strong claims need stated scope (first half vs late game) and humility about finishing variance.
Periods 1–2 (regulation)
Figures below cover the full regulation match (periods 1–2). One-game xG edges remain noisy — use them as process descriptors, not courtroom verdicts.
- Alemania
- 26 tiros · 1 goles · ~2.77 xG
- Pases progresivos: 143 (19.8% de los pases)
- Japón
- 12 tiros · 2 goles · ~1.25 xG
- Pases progresivos: 60 (27.9% de los pases)
Visual 1
Mapa de tiros
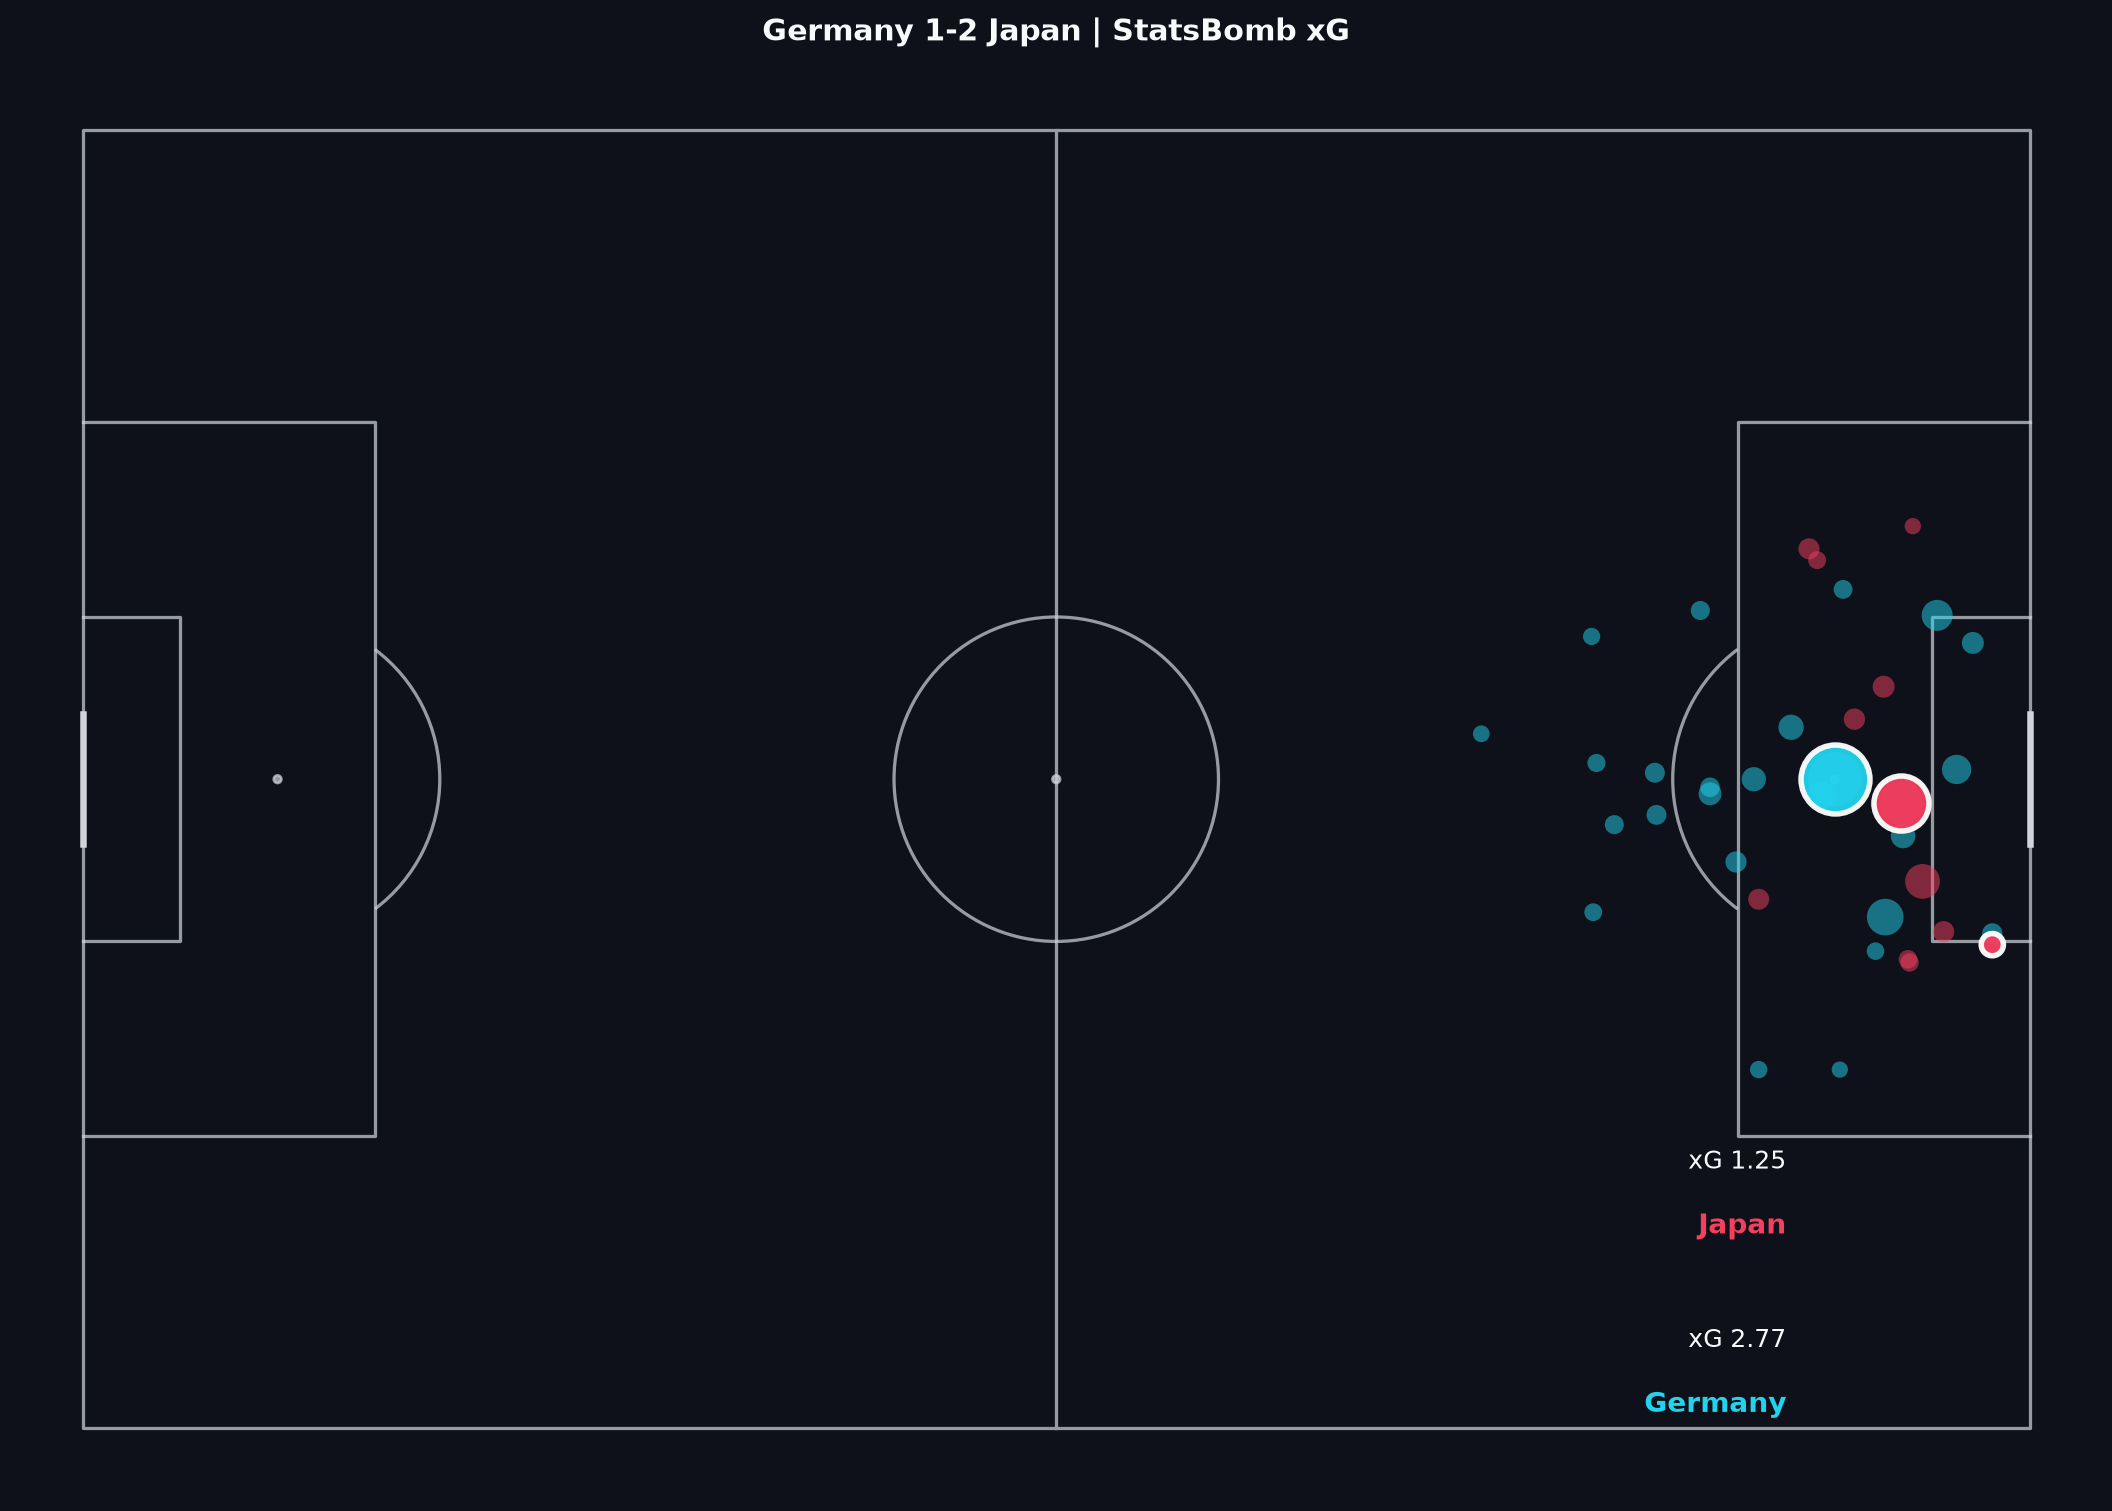
Germany’s markers show heavy volume (~26 shots, ~2.8 xG) with one goal; Japan’s fewer attempts (~12 shots, ~1.3 xG) yield two goals. Read process and outcome as related but separate layers.
Cómo leer esto
Los puntos detallados de “Cómo leer esto” están en inglés.
- Compare volume and quality together. A large German xG total describes chance creation; it does not prove the scoreline was ‘stolen’ in a moral sense.
- Locate Japan’s goals in space and timing (video). Conversion from a smaller sample is common football variance — especially in single matches.
- Ask which German attempts are speculative from distance versus box chances. Not every marker carries equal historical goal probability.
- Resist rewriting the whole match from the final score. The map supports a process story; the scoreline is one realisation of that process.
Lecciones de Learn relacionadas
Visual 2
Red de pases
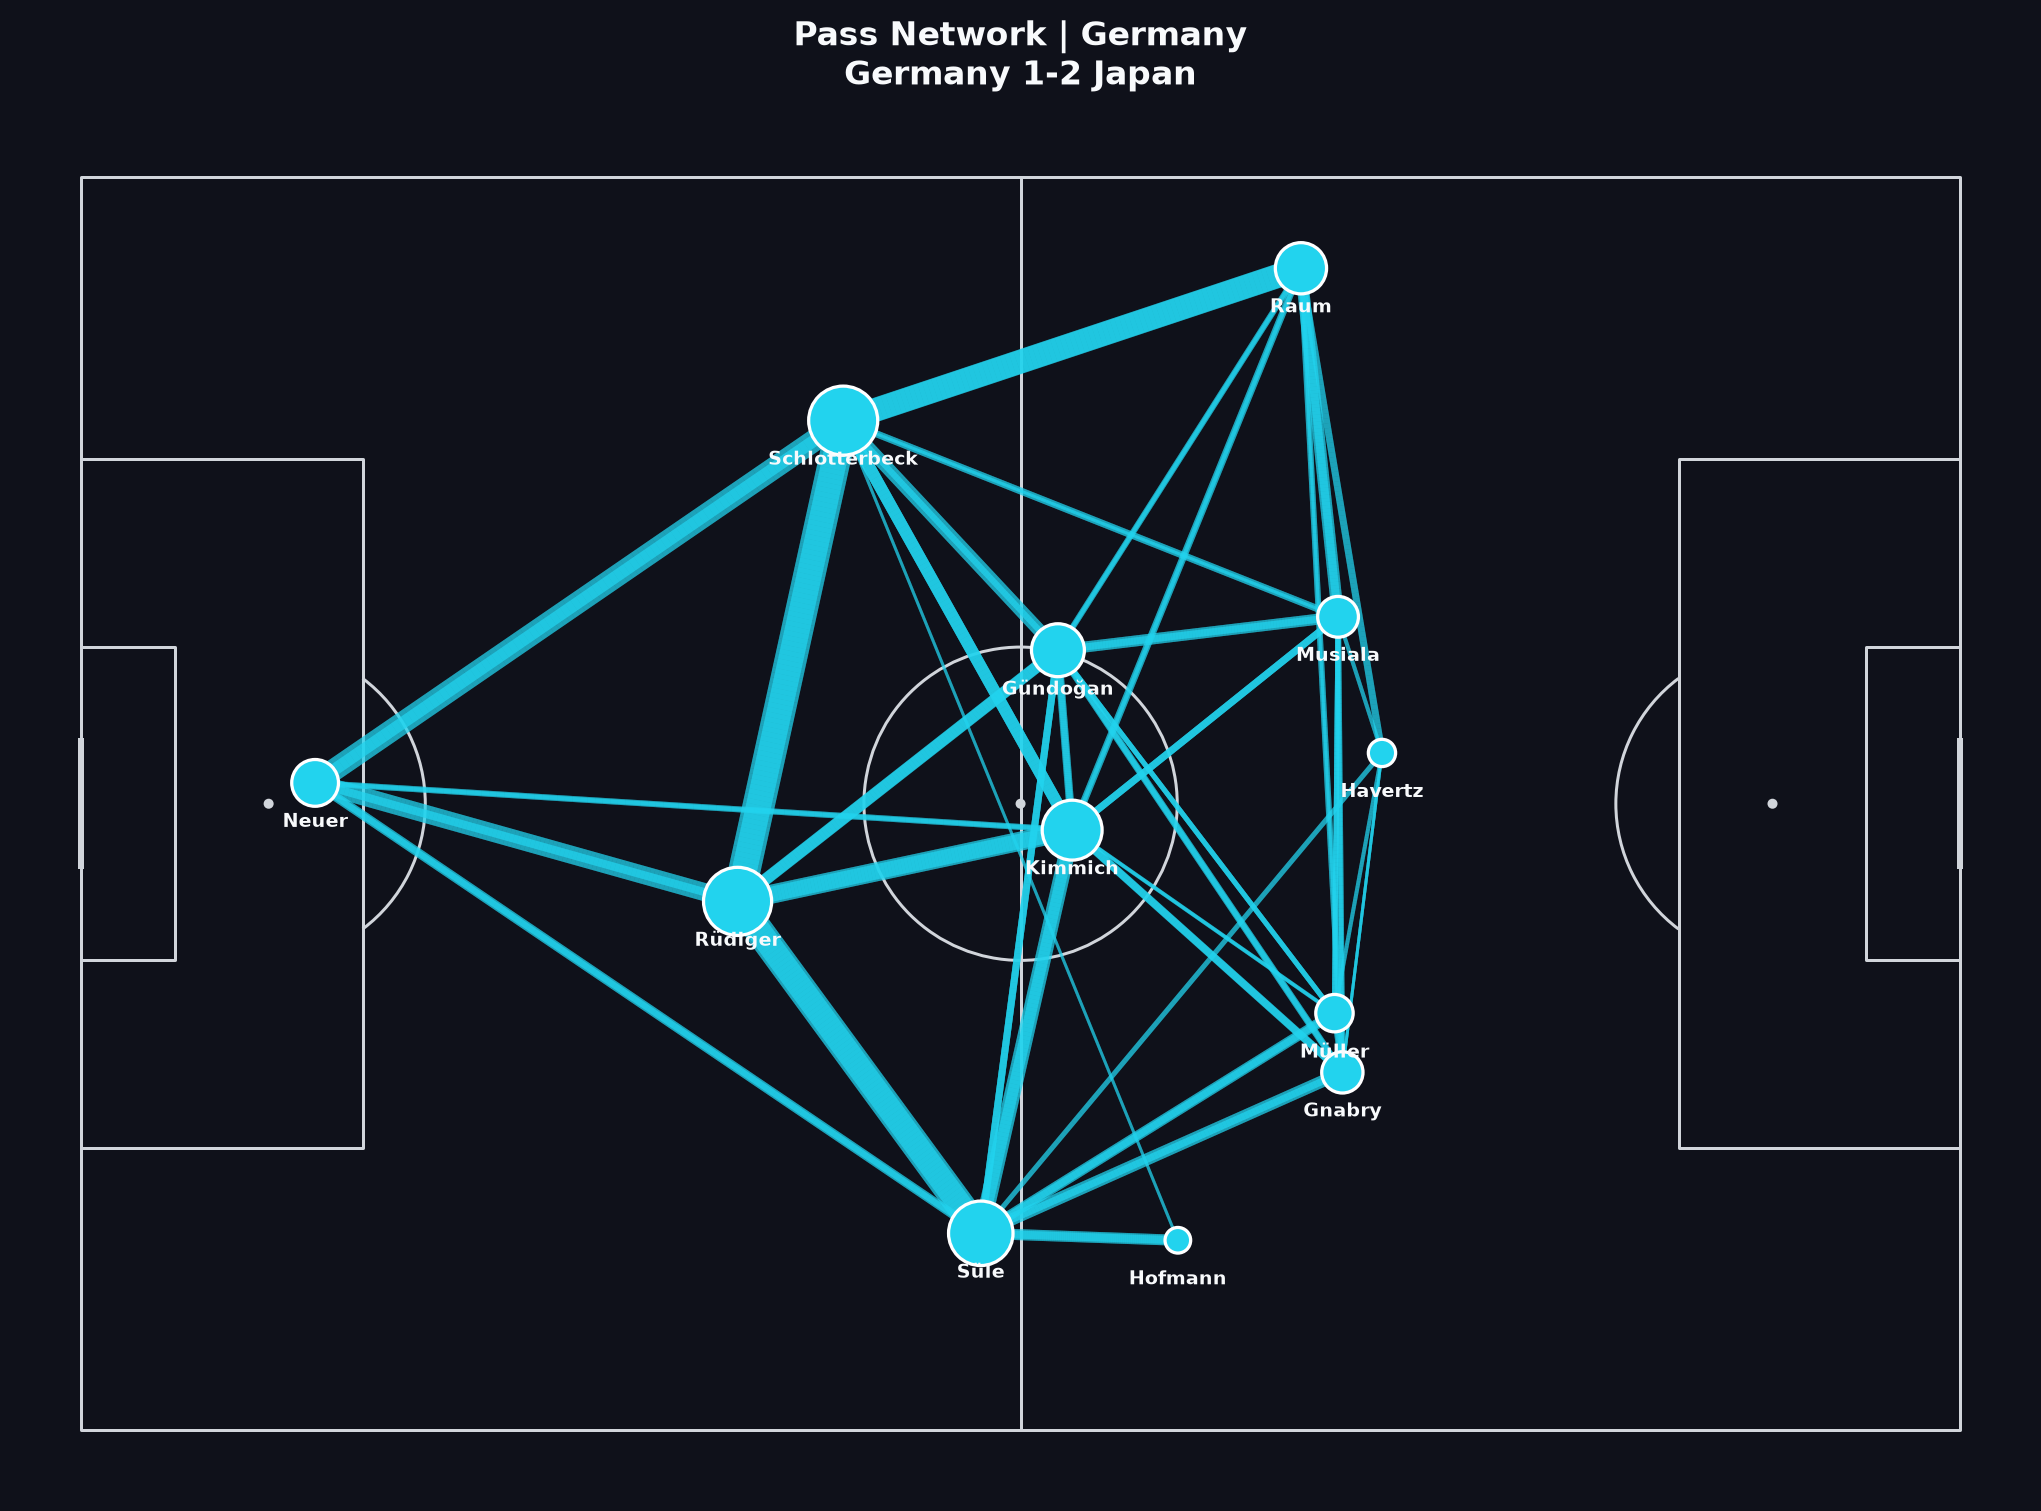
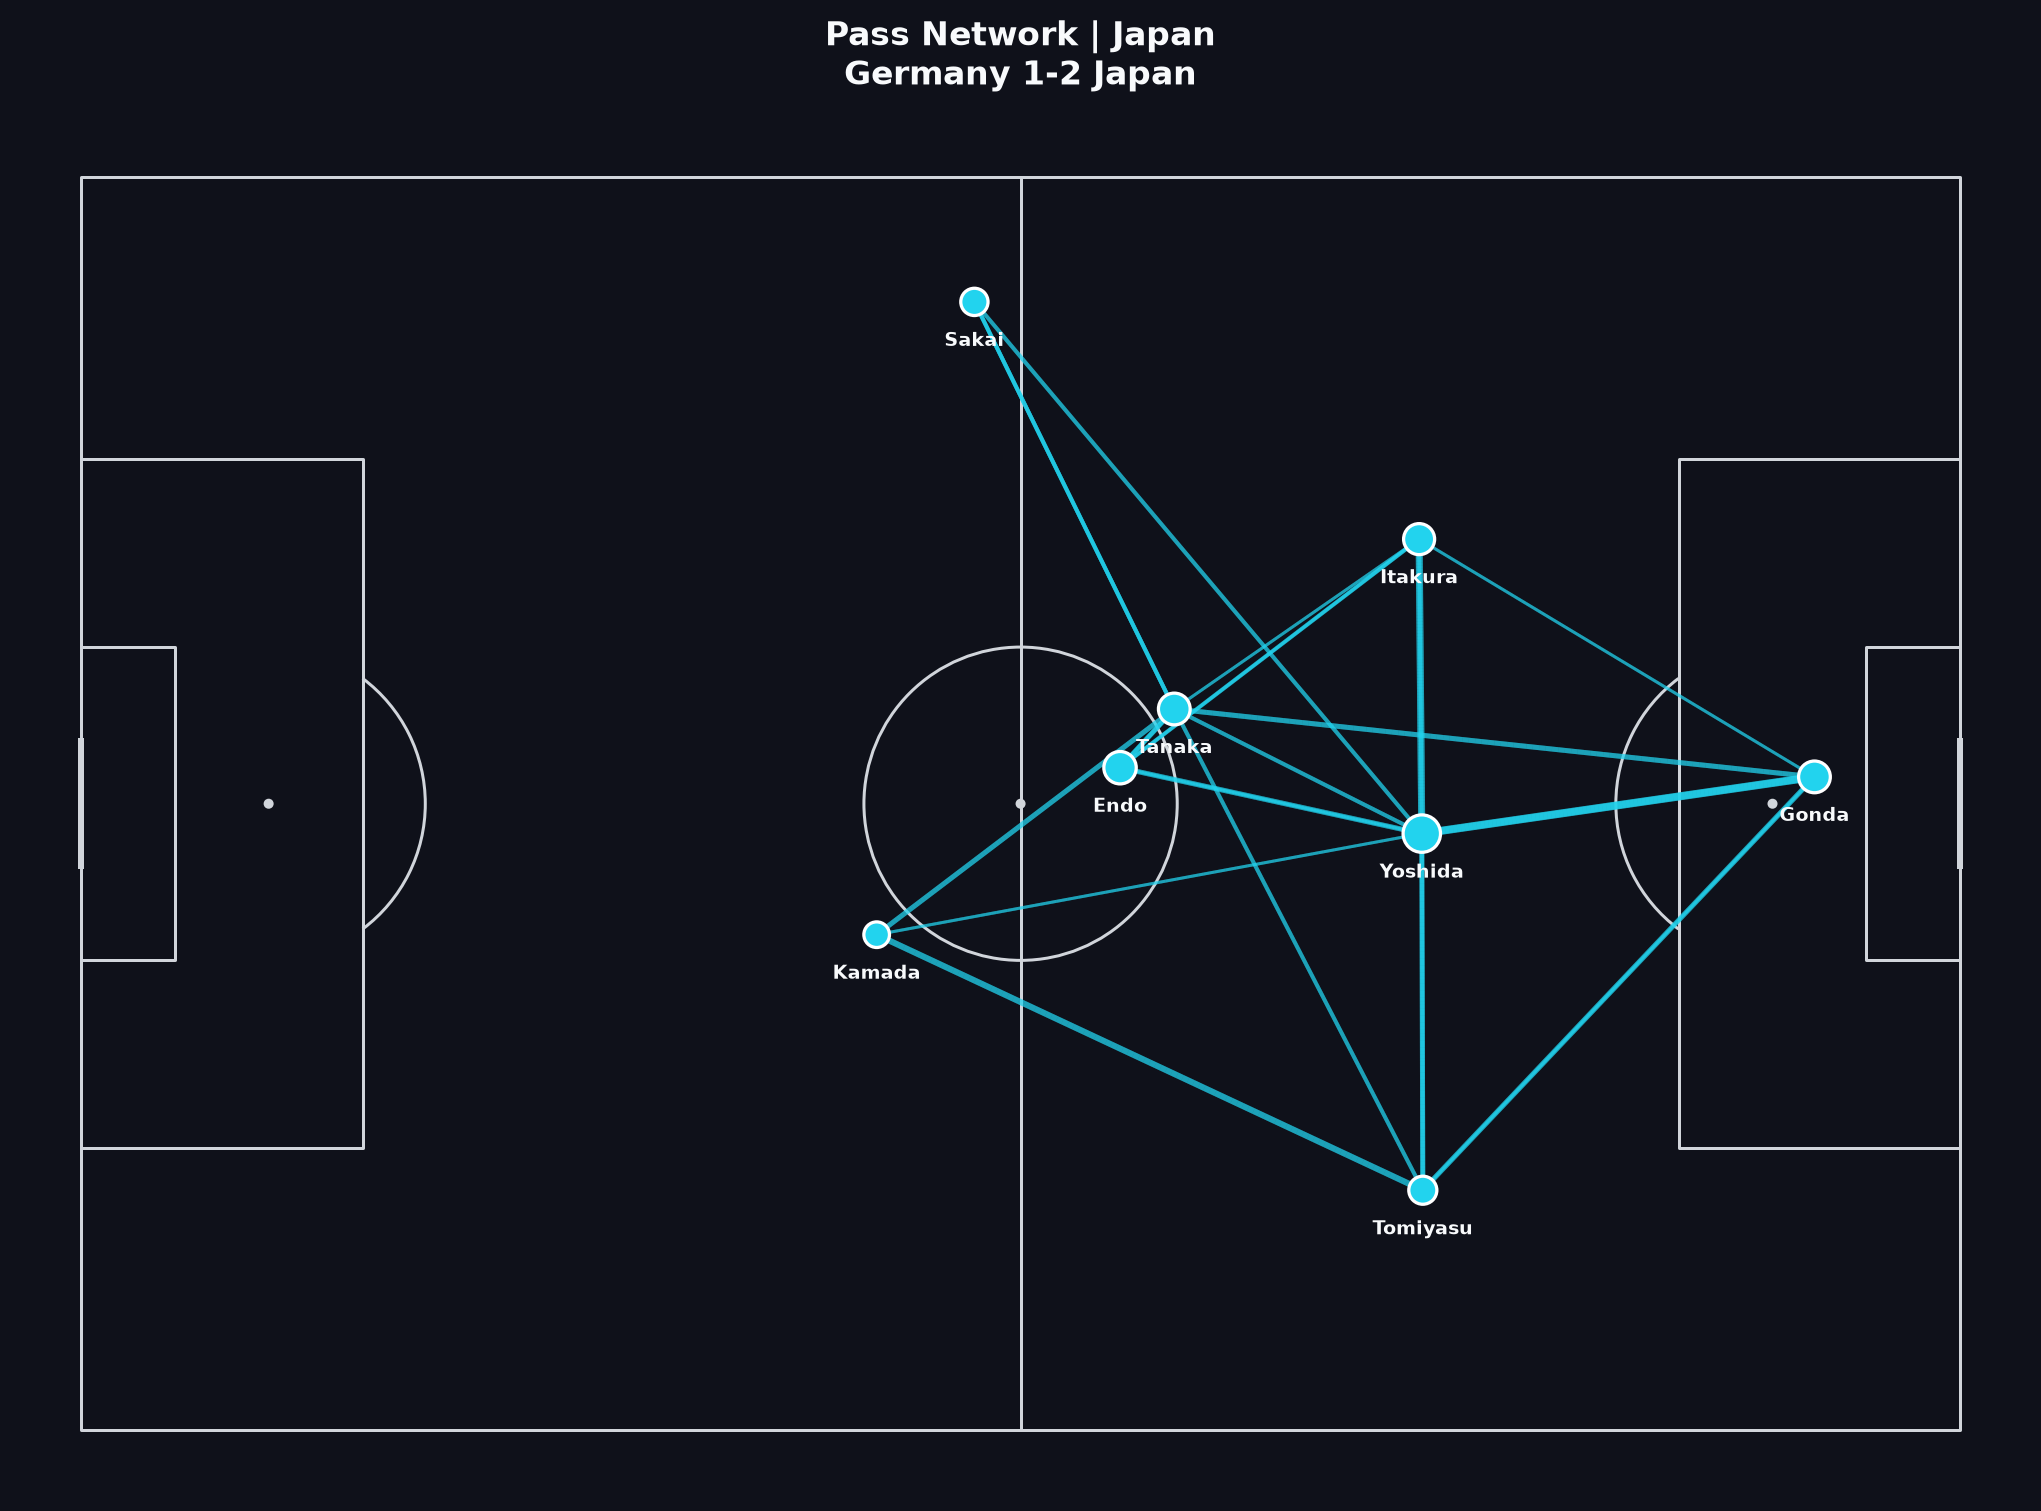
Germany’s denser network reflects higher on-ball volume; Japan’s lighter graph can still support dangerous transitions. Density ≠ superiority.
Cómo leer esto
Los puntos detallados de “Cómo leer esto” están en inglés.
- Identify German hubs between build-up and the final third. Frequent combinations explain territorial pressure more than they explain finishing.
- Japan’s thinner network may hide effective vertical connections after recoveries — confirm with progressive passes and video.
- Game state matters: a team protecting a lead or chasing a deficit changes who combines where.
- Use the network as a hypothesis generator for structure, not as a full tactical film.
Lecciones de Learn relacionadas
Visual 3
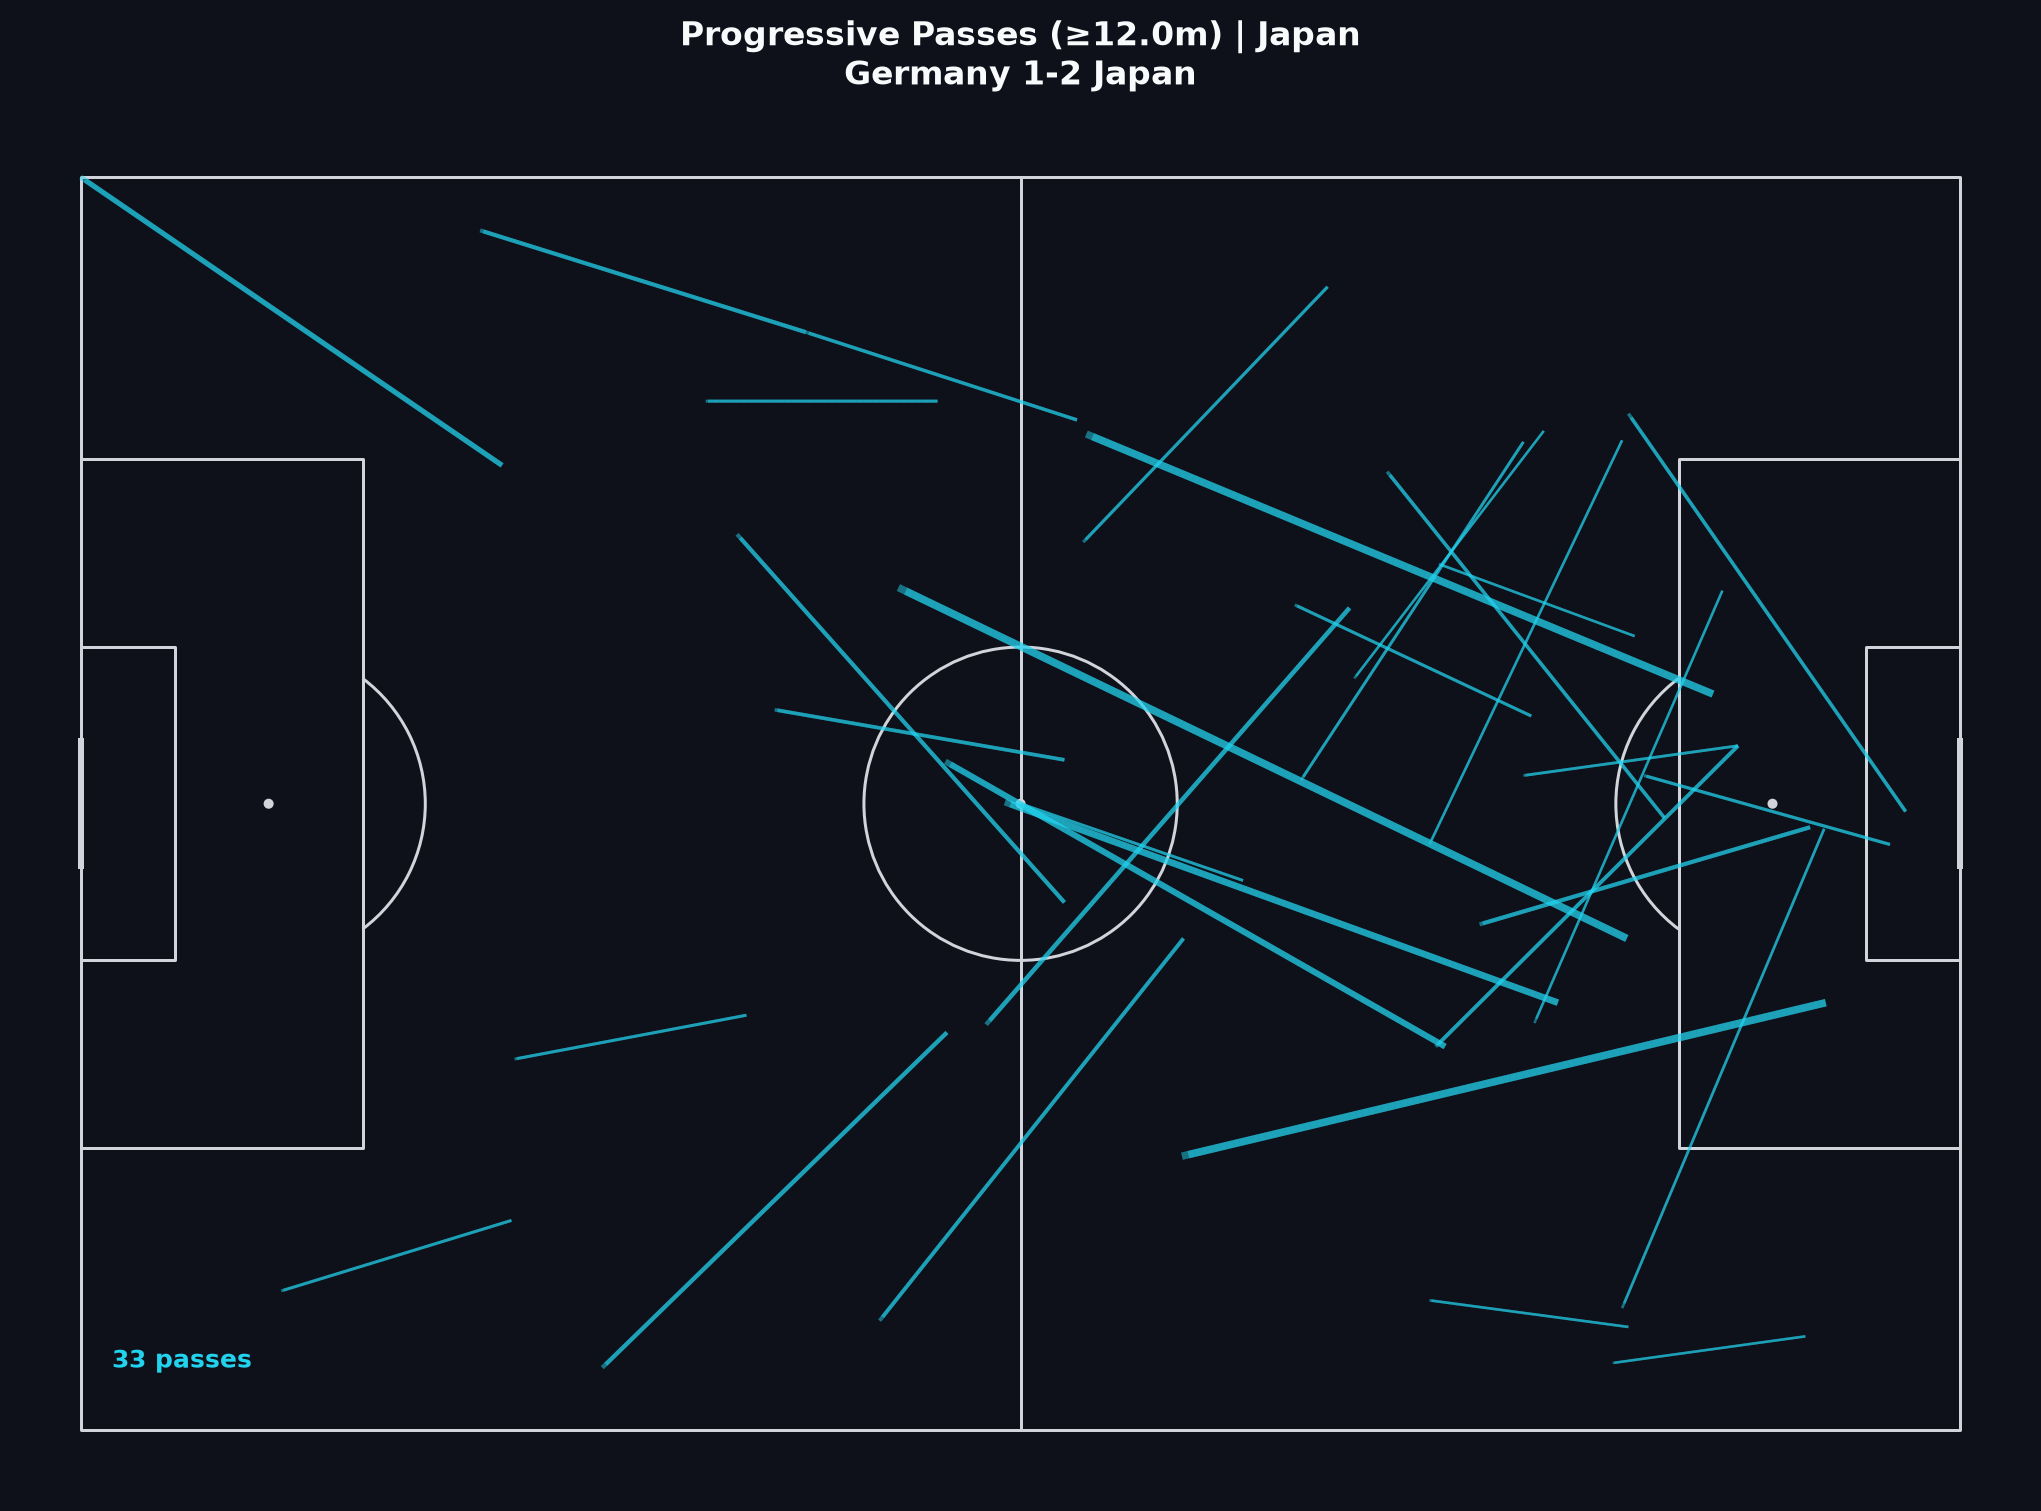
Pases progresivos
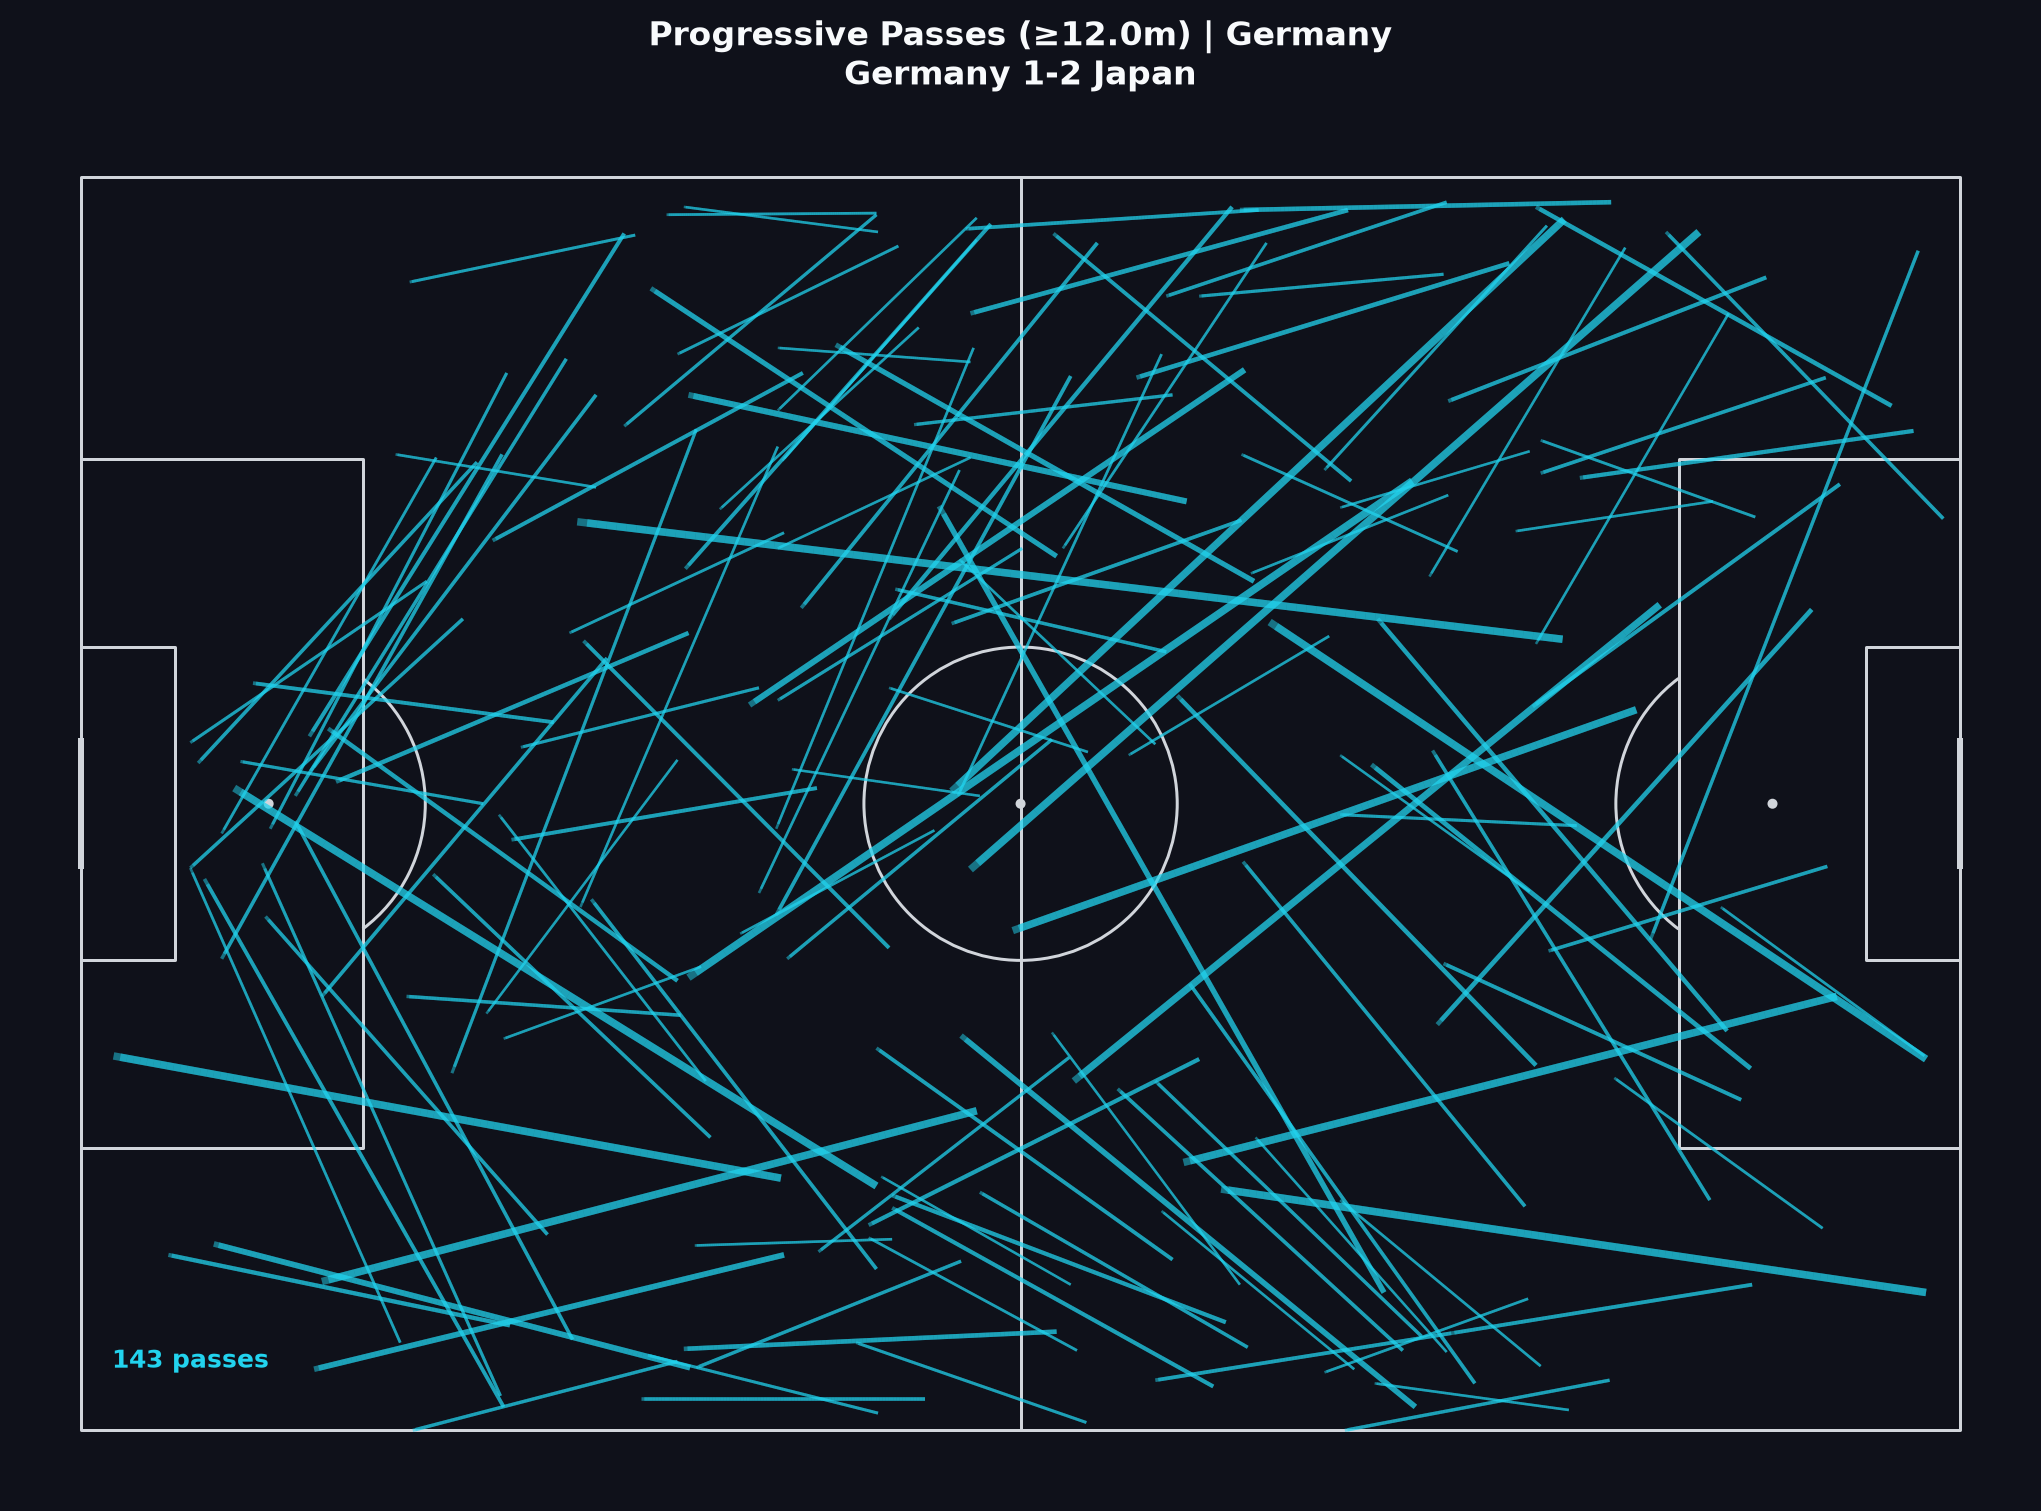
Germany progress more often in absolute terms (~143 vs ~60). Japan’s progressive share of completed passes is higher (~28% vs ~20%) on fewer total passes — useful for separating control from efficiency of advancement.
Cómo leer esto
Los puntos detallados de “Cómo leer esto” están en inglés.
- Absolute progressive volume tracks who advanced the ball more often; progressive share tracks how often completed passes gained territory.
- Pair with the shot map: German progression feeding many shots is a coherent process story even when conversion disappoints.
- Ask where progressions end. Entries into the box differ from sideways gains near halfway.
- Avoid ranking teams by one progressive number after a surprising scoreline — state the metric and the sample.
Lecciones de Learn relacionadas
Visual 4
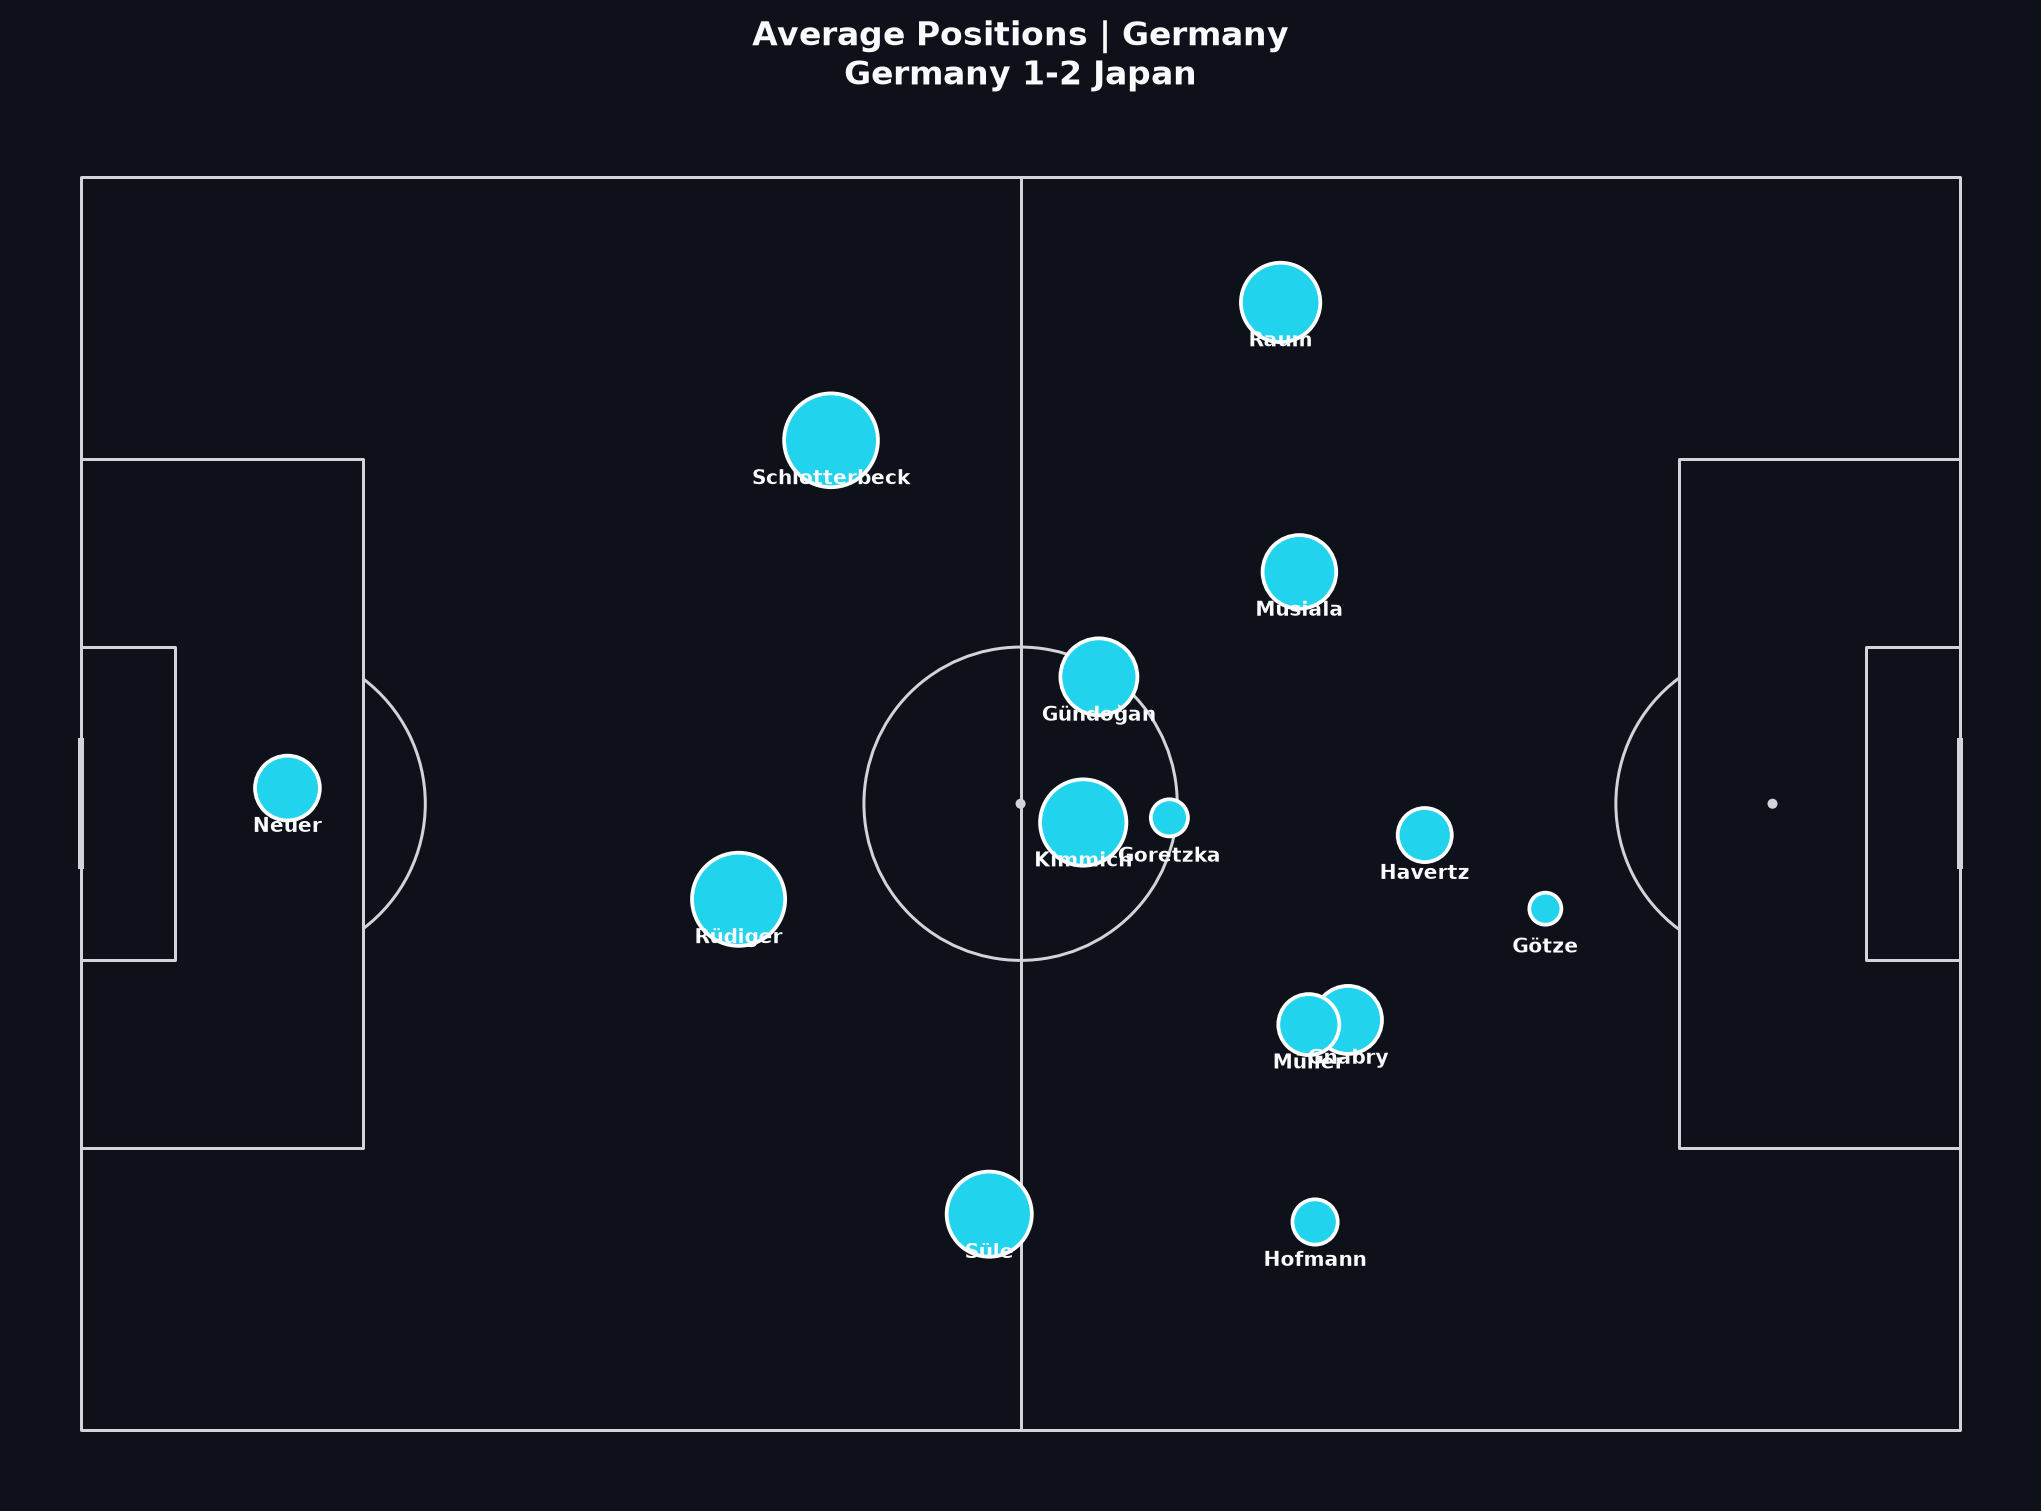
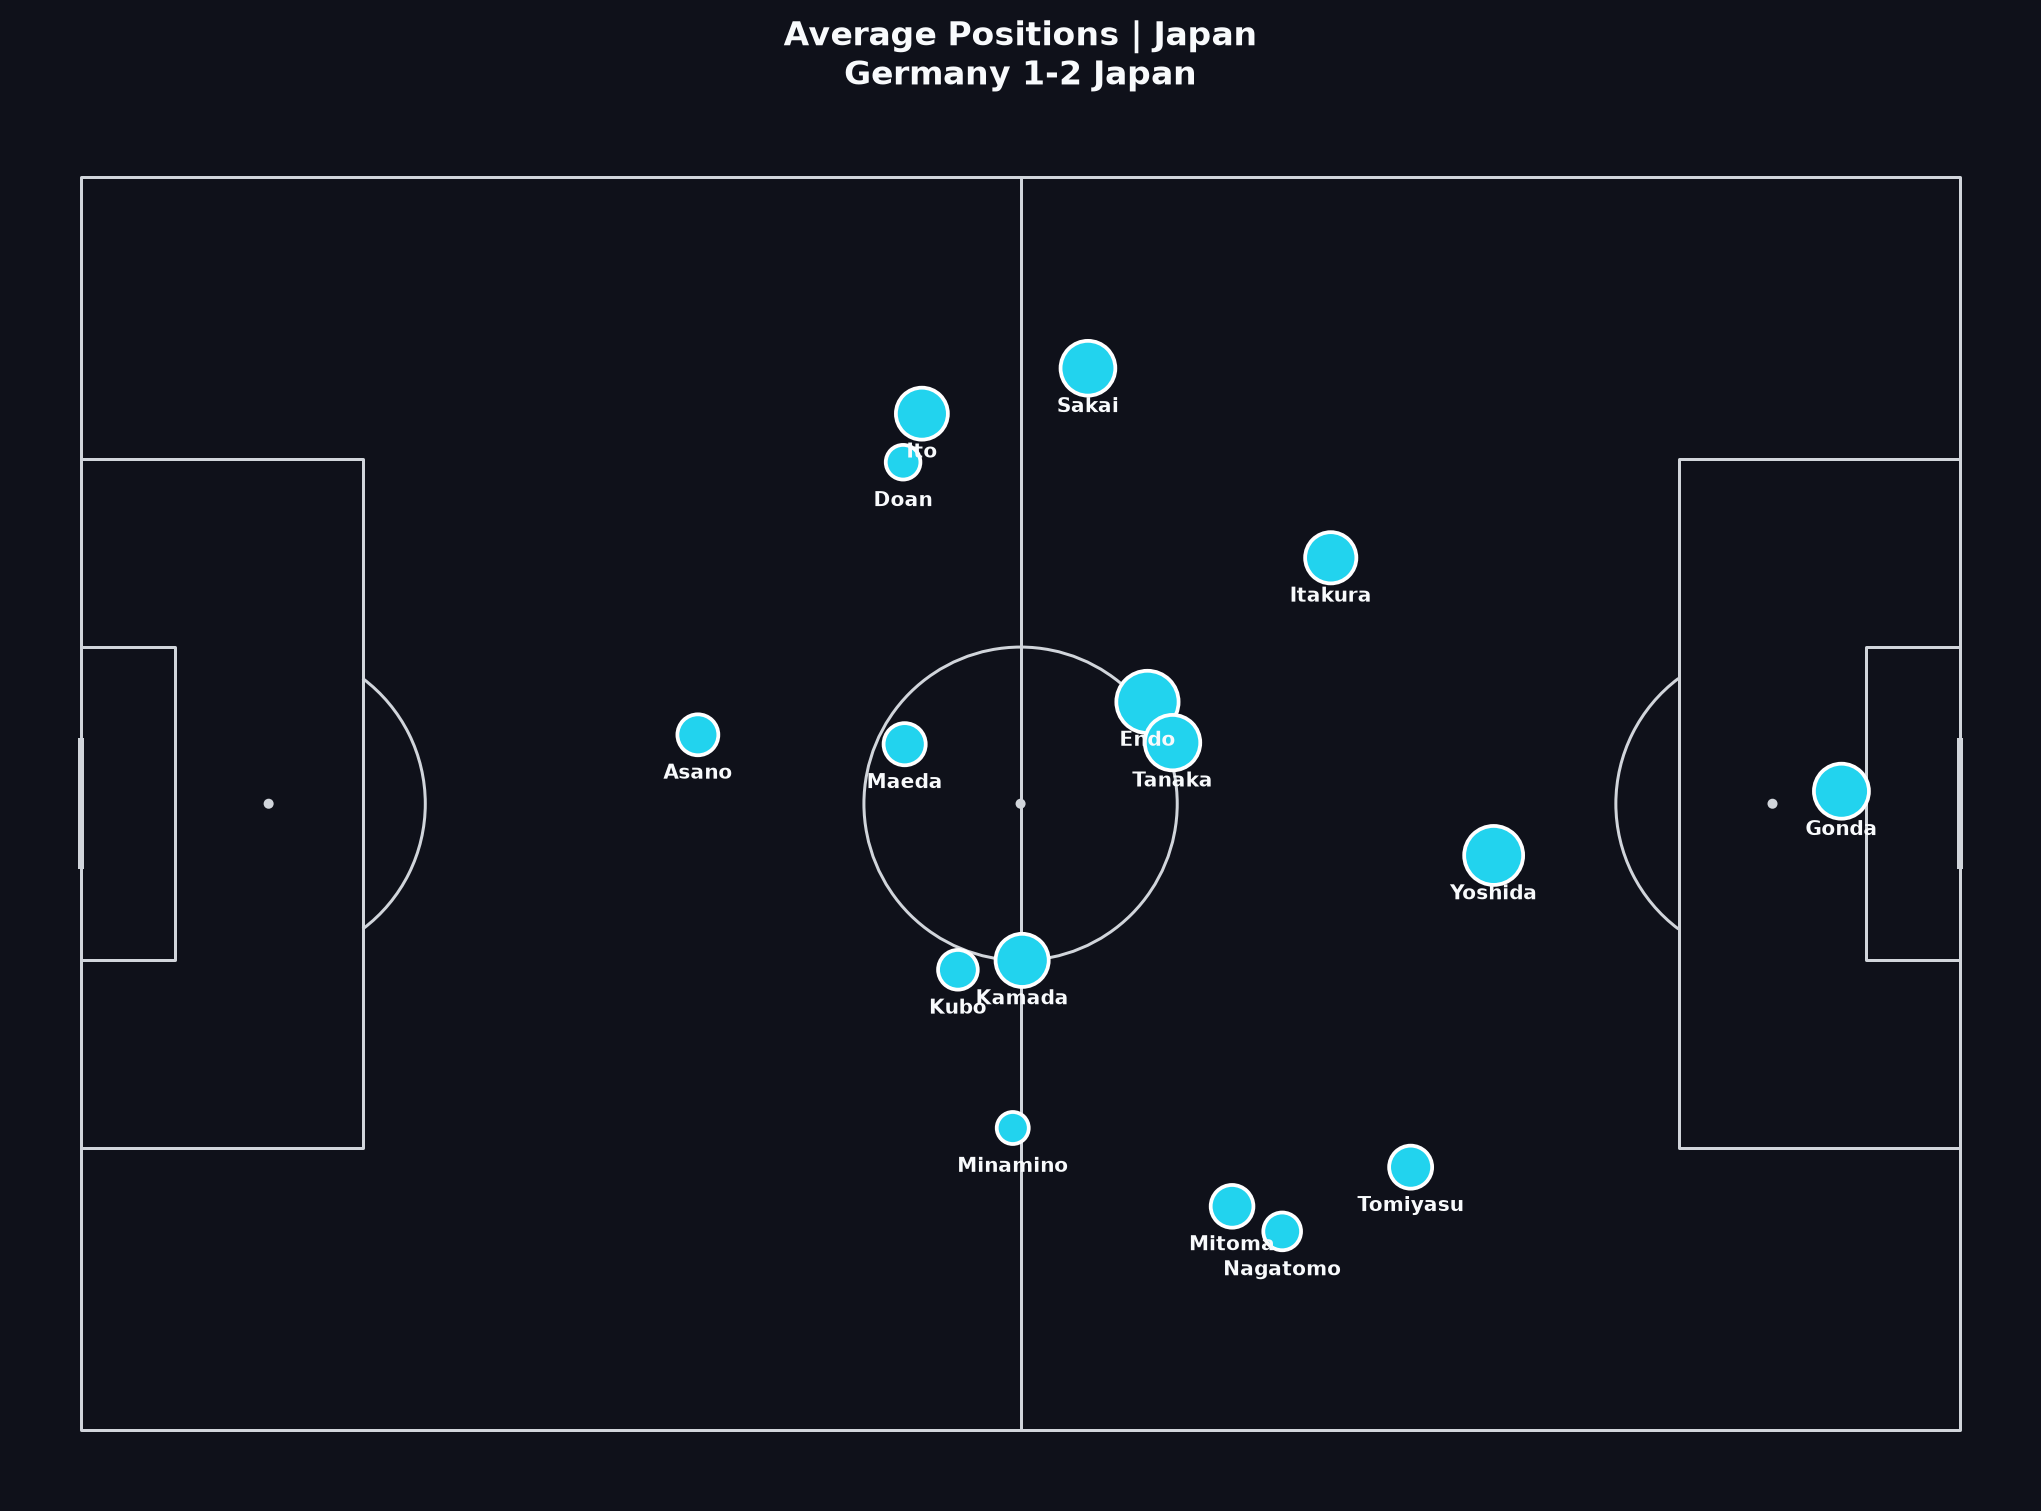
Posiciones medias
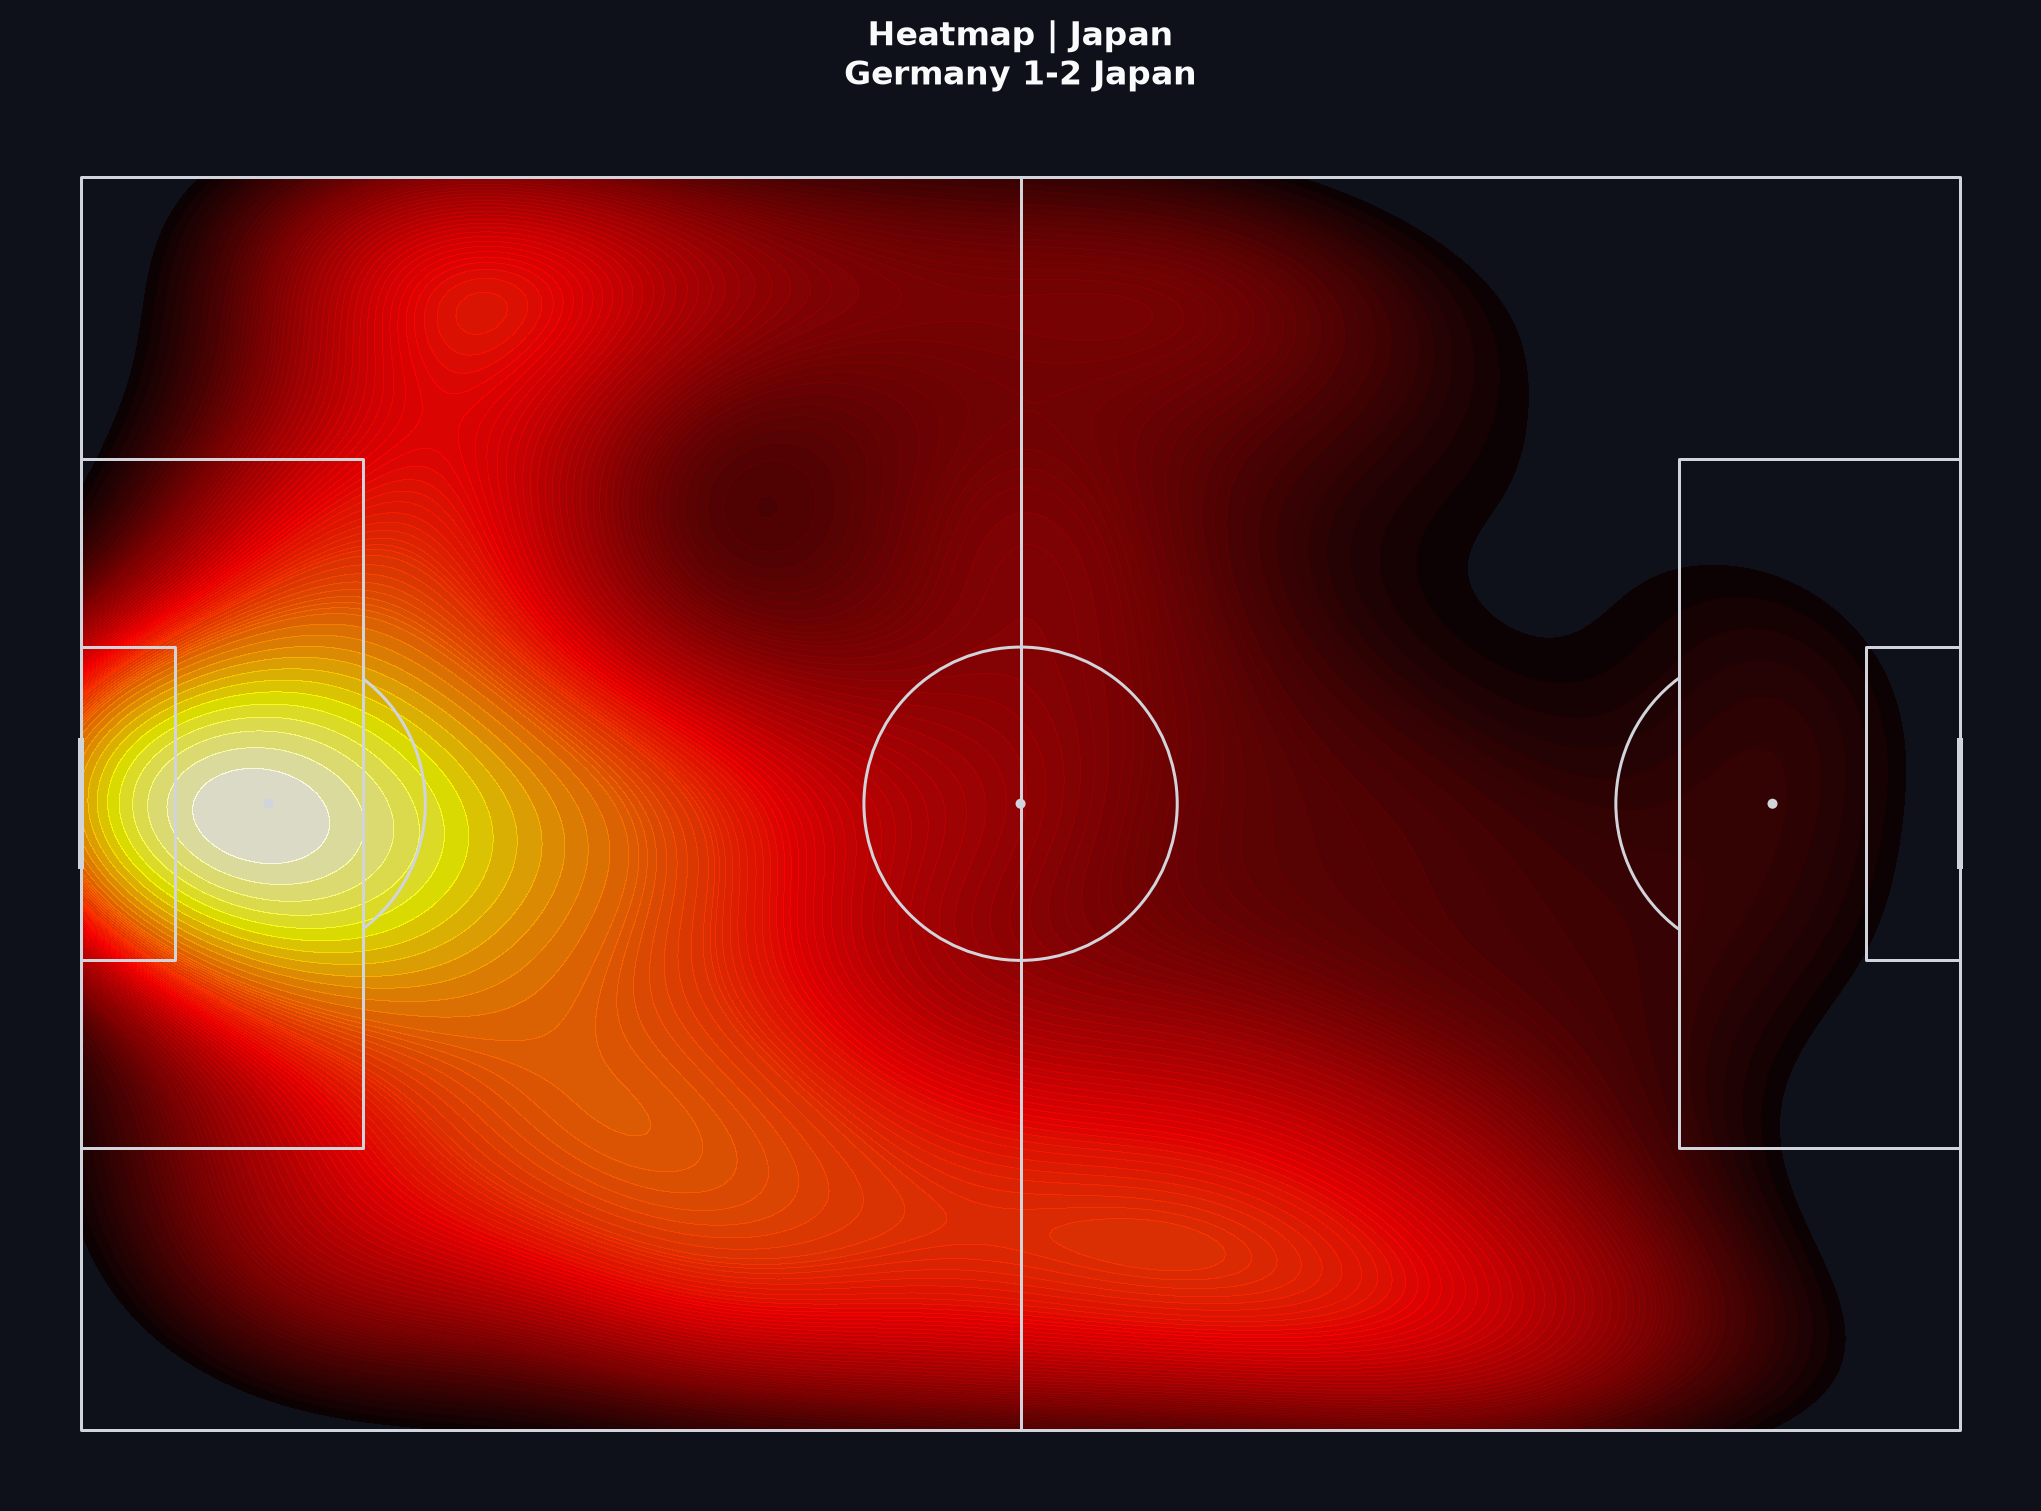
Averages compress ninety minutes of shifting states. Use them with heatmaps to ask where pressure lived — especially after Japan’s equaliser changed the match.
Cómo leer esto
Los puntos detallados de “Cómo leer esto” están en inglés.
- German averages often sit higher when they dominate territory; Japanese averages may look deeper early and shift with match state.
- Heatmaps (below) show density piles that a single average point can hide — especially for wide attackers or late substitutes.
- Do not treat average positions as chalkboard formations. They summarise involvement locations, not every defensive shape.
- Form a question about pressing height or rest-defence, then verify on video before strong claims.
Lecciones de Learn relacionadas
Juntarlo todo
El cierre permanece en inglés por precisión.
A responsible short report would separate Germany’s chance-creation process from Japan’s conversion, state that single-match xG is noisy, and avoid claiming the visuals prove a ‘robbery’ narrative.
If you are following the Learn path, write five sentences using only claims these visuals can support — then note what still requires video and match-state timestamps.
Practice prompt
In 150–200 words: (1) one process claim about Germany’s shot volume or progression, (2) one claim about Japan’s efficiency or territorial shape, (3) one sample-size / match-state limitation. Link each claim to a visual above.
Event data from StatsBomb’s public World Cup 2022 release. Coordinates use StatsBomb’s pitch model.