
آزمایشگاه بازی / جام جهانی فوتبال ۲۰۲۲
فینال · 2022-12-18
آرژانتین 3–3 فرانسه
پس از وقت اضافه · آرژانتین در ضربات پنالتی پیروز شد
ورزشگاه لوسیل · StatsBomb Open Data
عنوانها و خلاصهها بومیسازی شدهاند. راهنماهای خواندن تفصیلی در ادامه برای دقت به انگلیسی ماندهاند.
چرا این بازی برای یادگیری مفید است
- این مسابقه مشهور است، بنابراین یادگیرندگان از قبل روایت را میدانند — که جدا کردن داستان از شواهد را آسانتر میکند.
- خلق موقعیت در نیمهها و وقت اضافه نابرابر بود. این موضوع نیازمند خوانش دقیق نقشههای شوت بر اساس فاز بازی است، نه فقط نتیجه نهایی.
- شبکه پاس آرژانتین و نقشه پاسهای پیشرونده پیشرفت ساختاری را نشان میدهد؛ پاسخ دیرهنگام فرانسه نشان میدهد چگونه وضعیت بازی میتواند تصویر را تغییر دهد بدون بازنویسی فرایند قبلی.
- ضربات پنالتی در دوره ۵ فایل دادههای باز قرار دارد. ترکیب شوتهای پنالتی با xG بازی باز اشتباهی رایج است که این مسابقه به آشکارسازی آن کمک میکند.
بافت بازی
آرژانتین با نتیجه ۲–۰ پیش بود، فرانسه در دقایق پایانی وقت قانونی بازی را مساوی کرد و هر دو تیم در وقت اضافه گل زدند (۳–۳). سپس آرژانتین در ضربات پنالتی پیروز شد.
برای آموزش، وقت قانونی + وقت اضافه (دورههای ۱ تا ۴) را فرایند بازی در نظر بگیرید. دوره ۵ (پنالتیها) تمرینی جداگانه است: تلاشهای با xG بالا تحت قوانین ویژه.
دورههای ۱ تا ۴ (۹۰ دقیقه + وقت اضافه)
اعداد زیر ضربات پنالتی (دوره ۵) را شامل نمیشود تا خوانش فرایند بازی با xG پنالتی مخدوش نشود.
- آرژانتین
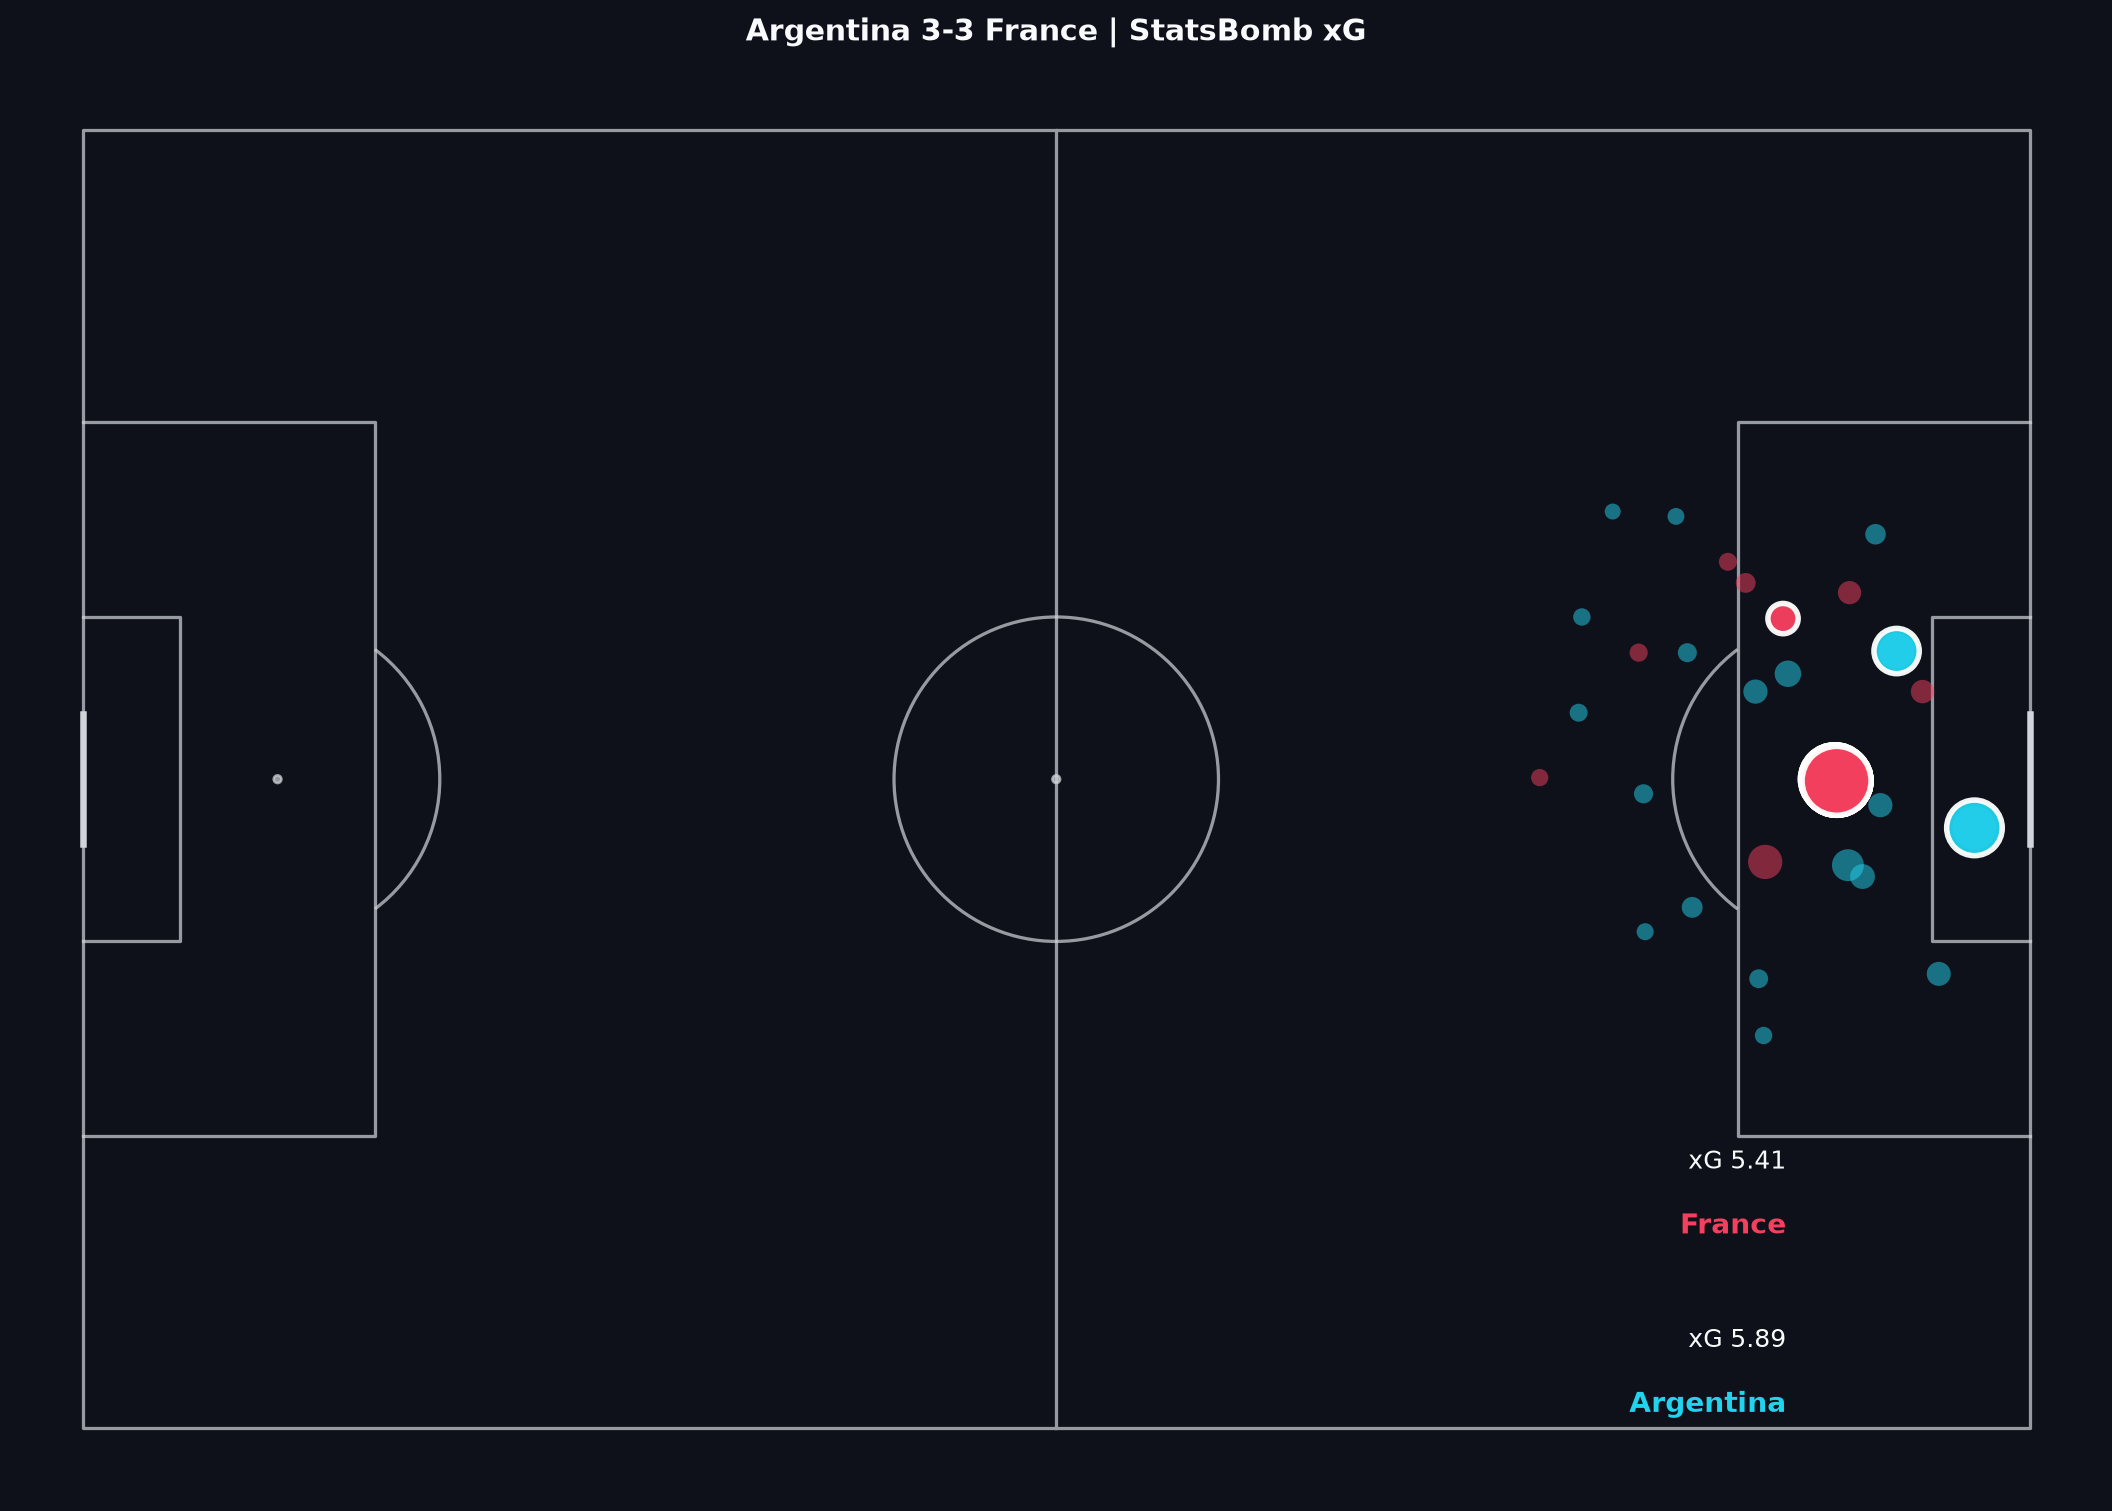
- 20 شوت · 3 گل · ~2.76 xG
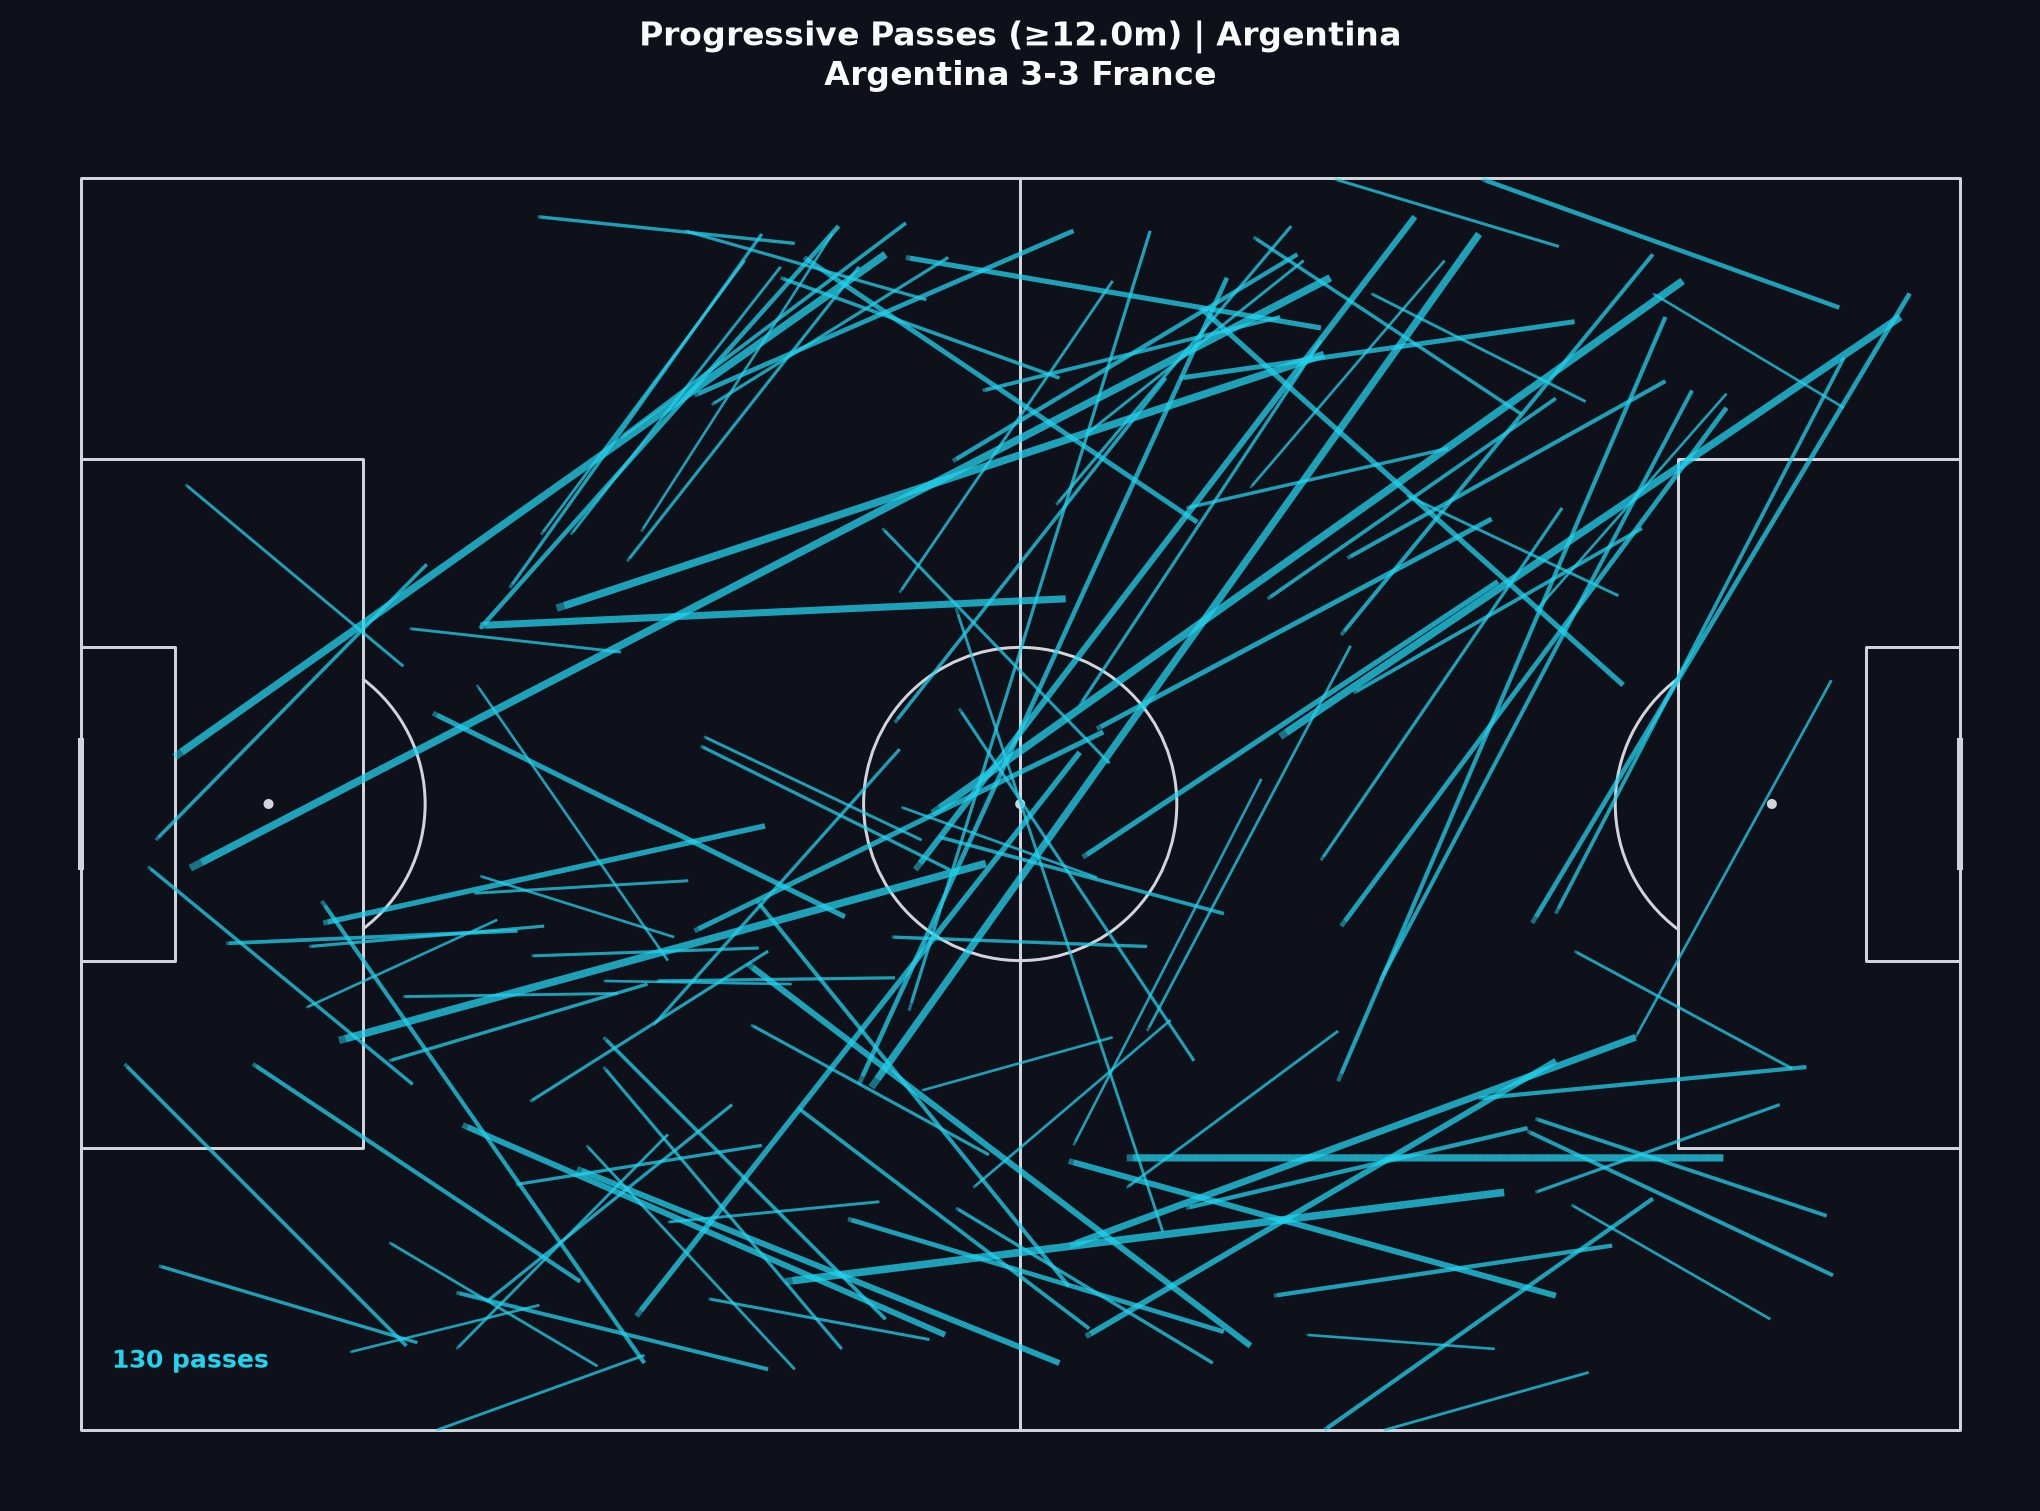
- پاسهای پیشرونده: 130 (23.2% از پاسها)
- فرانسه
- 10 شوت · 3 گل · ~2.27 xG
- پاسهای پیشرونده: 56 (12.9% از پاسها)
تصویر 1
نقشه شوتها
هر علامت یک شوت است. مکان، حجم و کیفیت اهمیت بیشتری از شمارش نقاط دارد. این نقشه را با توجه به نکته دورهها بخوانید: ابتدا فرایند، سپس پنالتی.
چگونه این را بخوانید
نکات تفصیلی «چگونه بخوانید» به انگلیسی است.
- Start with location clusters, not the scoreline. Central box attempts usually carry more historical goal probability than speculative efforts from distance.
- Compare volume and quality together. Argentina recorded more shots in periods 1–4; France’s conversion relative to fewer attempts is part of the late-game story, not proof that earlier Argentine control ‘did not matter’.
- Ask which chances came from open play versus set pieces, and whether a cluster reflects sustained territorial pressure or a short burst.
- Do not invent a formation story the map cannot prove. A shot map shows outcomes of chances, not every off-ball run that created them.
درسهای مرتبط Learn
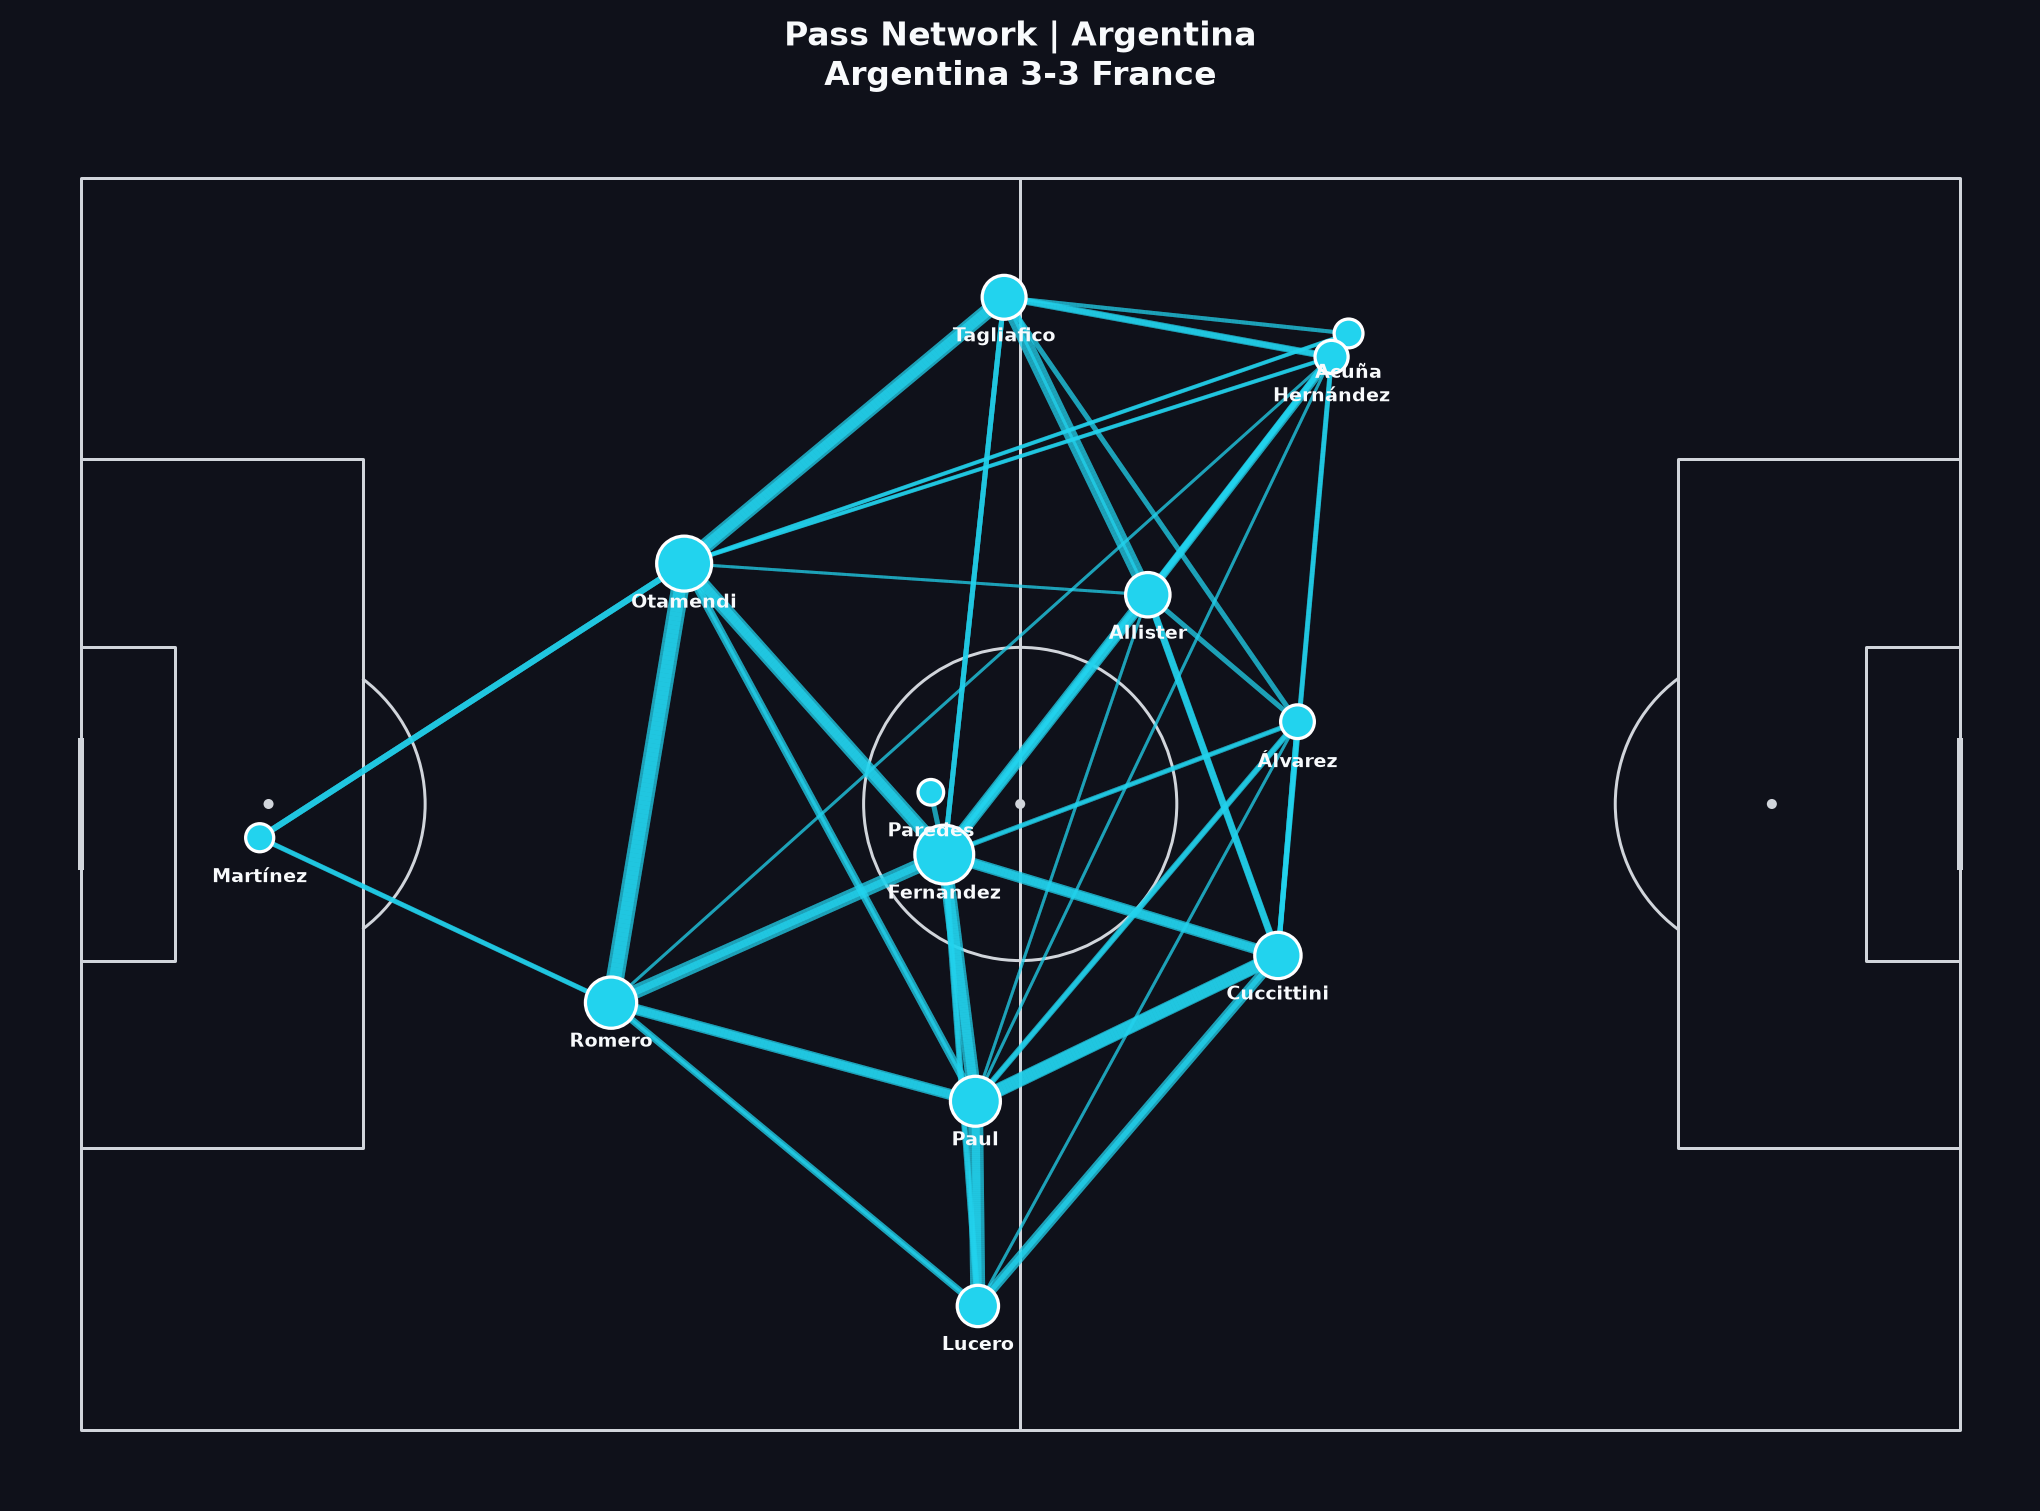
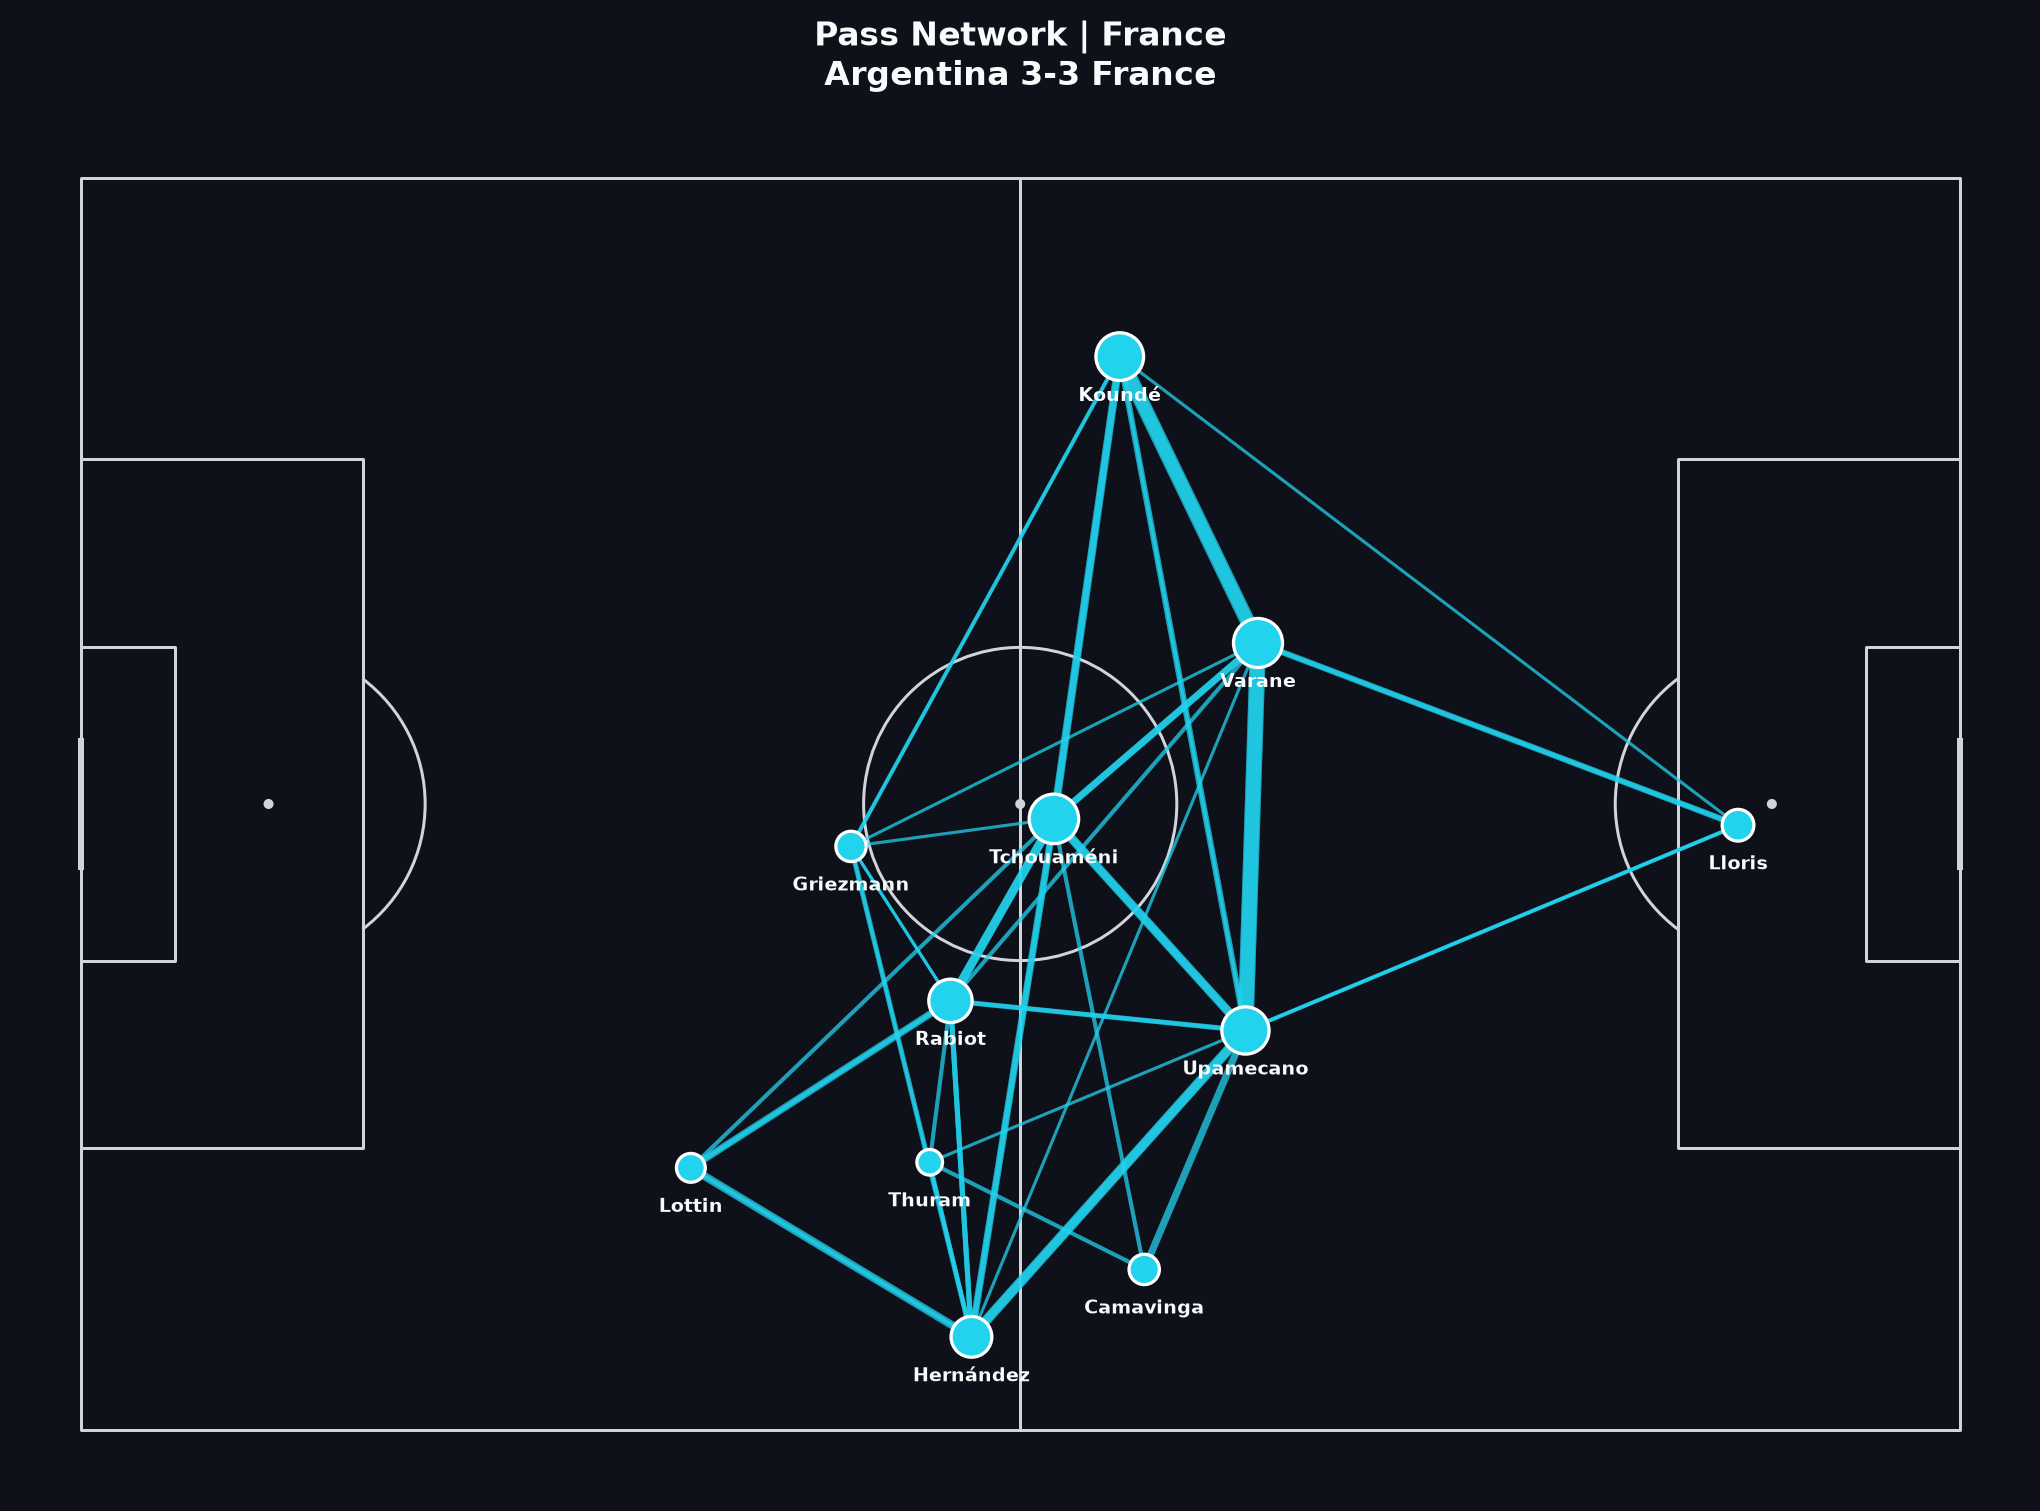
تصویر 2
شبکه پاس
گرهها بازیکنان (مکانهای میانگین توپدار) هستند؛ یالها اتصالات پاسهای کامل شده را نشان میدهند. خطوط ضخیمتر یا قویتر معمولاً به معنای ترکیبهای مکررتر است — نه لزوماً فوتبال بهتر.
چگونه این را بخوانید
نکات تفصیلی «چگونه بخوانید» به انگلیسی است.
- Look for hubs and corridors. Who receives in central zones? Who connects the first line to the final third?
- A dense network on one flank can mean intentional overloads — or forced circulation away from pressure. Confirm with video before naming a ‘plan’.
- Compare Argentina’s denser progressive structure with France’s more selective connections. Difference in volume is informative; it is not a moral ranking.
- Substitutions and game state change networks. A final with long extra time mixes several match phases into one average picture.
درسهای مرتبط Learn
تصویر 3
پاسهای پیشرونده
پاسهای پیشرونده توپ را به طور معناداری به سمت دروازه حریف حرکت میدهند (اینجا: حداقل حدود ۱۲ متر پیشرفت طبق تعریف football-ai برای ترسیم این نقشهها). این پاسها کمک میکنند مالکیت بیثمر را از کسب قلمرو جدا کنیم.
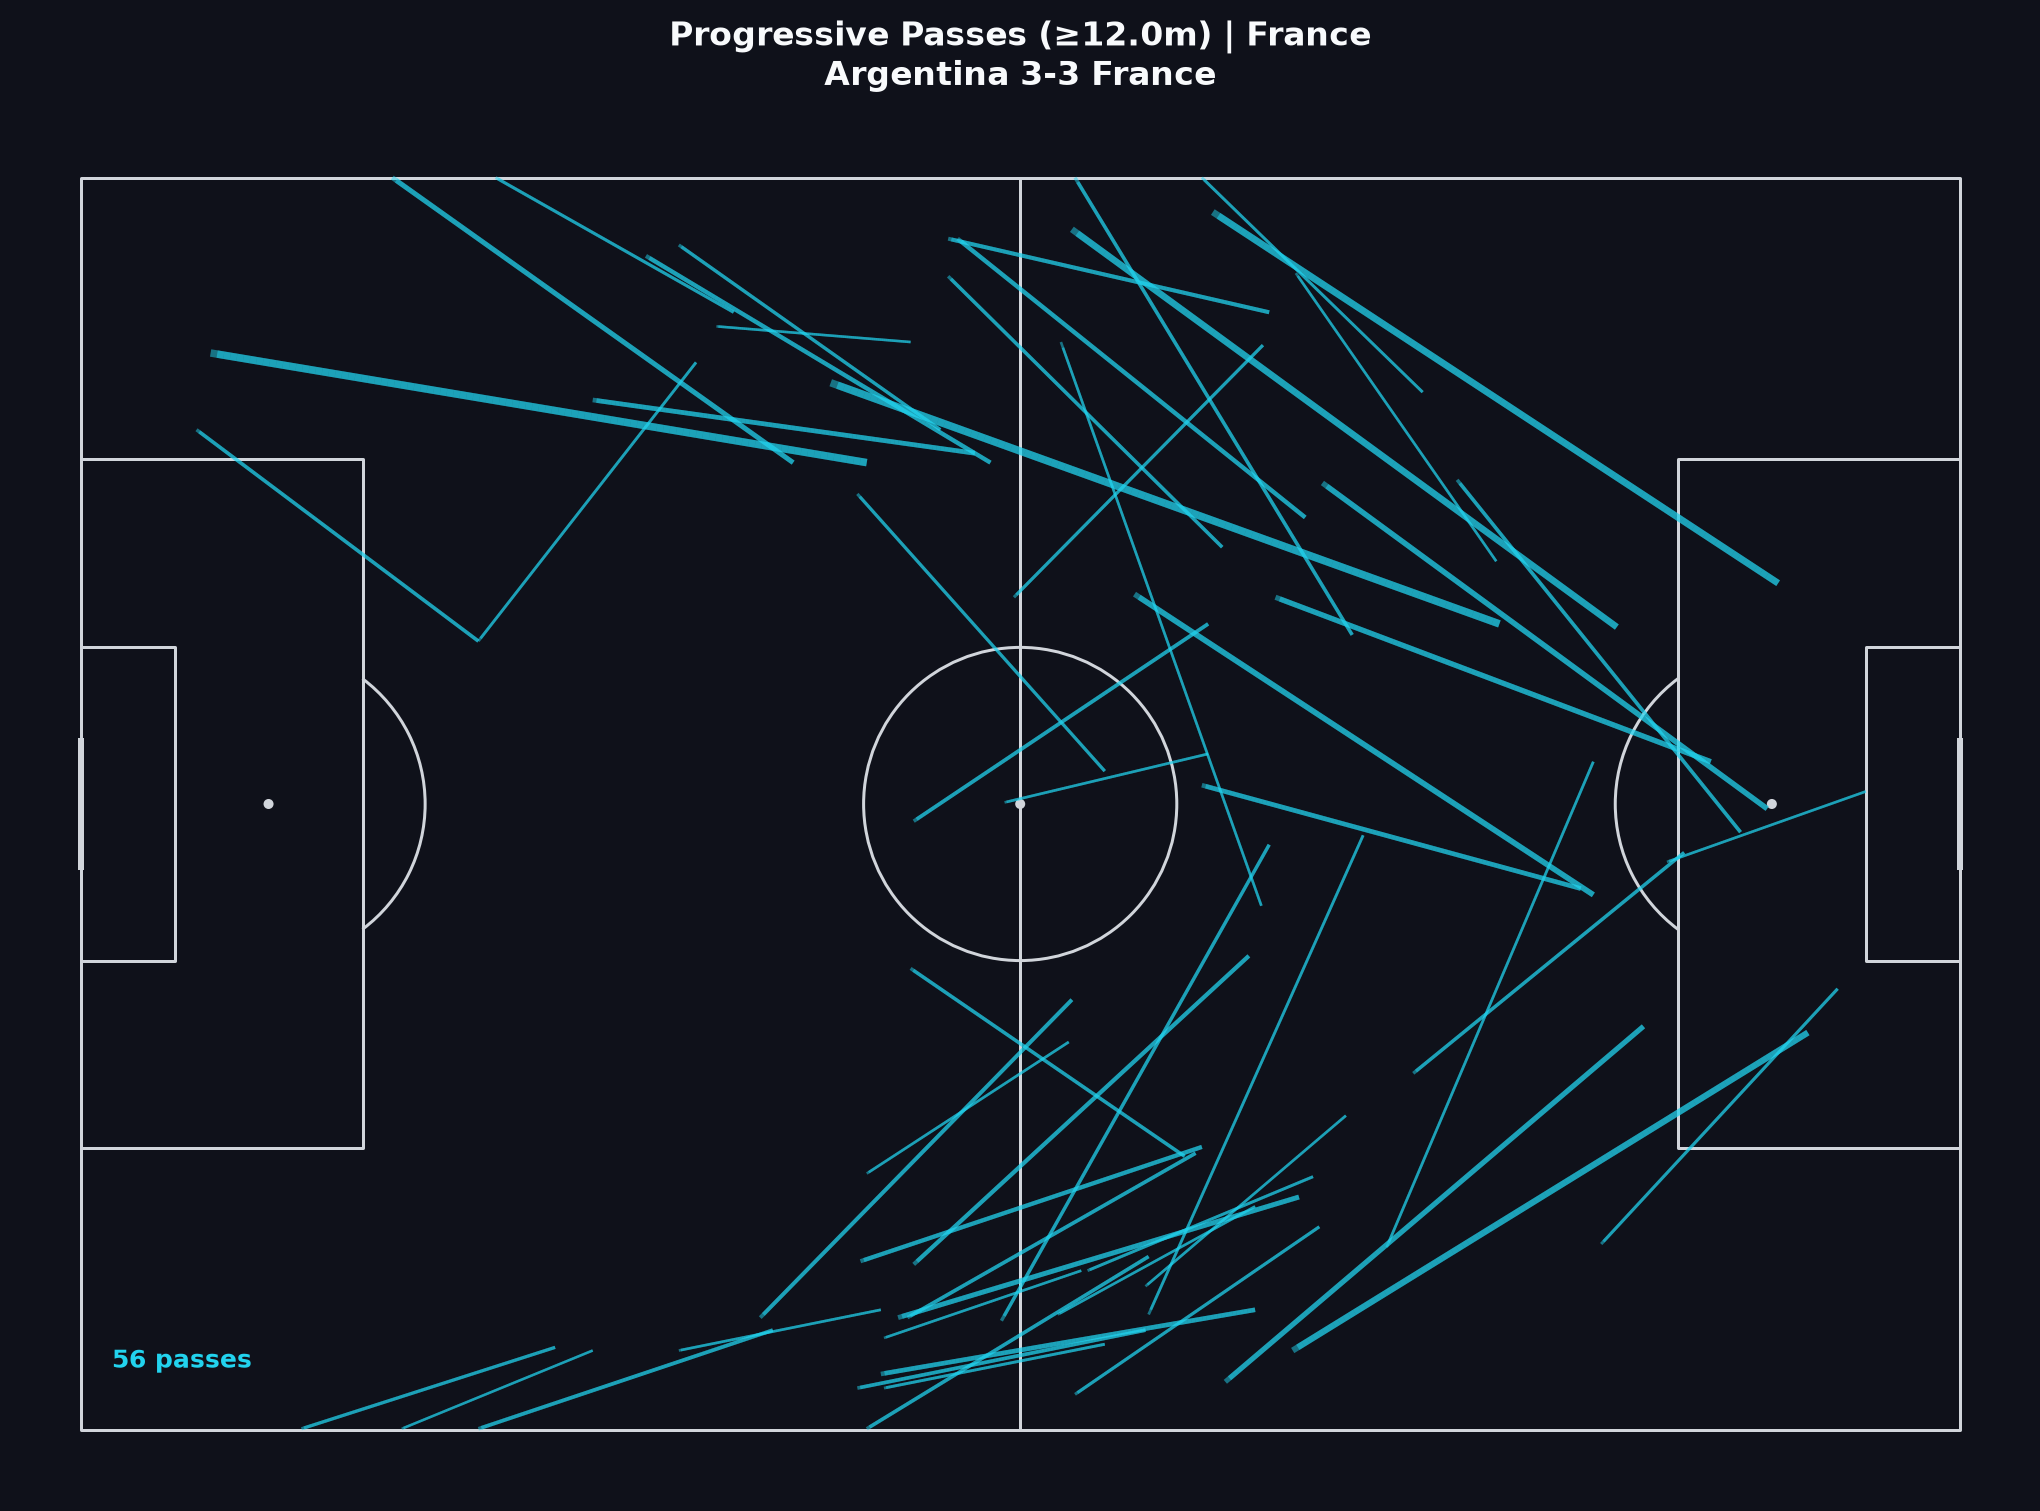
چگونه این را بخوانید
نکات تفصیلی «چگونه بخوانید» به انگلیسی است.
- High progressive volume suggests a team repeatedly advanced the ball; it does not guarantee high-quality shots at the end of those advances.
- Argentina’s progressive share (~23% of passes in this rendering) is substantially higher than France’s (~13%). Read that as a process difference across the match file, then ask when France’s dangerous moments arrived.
- Trace start and end zones. Progression into the half-space or box carries different tactical meaning from sideways progress near halfway.
- Pair this map with the shot map: progression without shots can be sterile control; shots without progression can be transition or set-piece dependent.
درسهای مرتبط Learn
تصویر 4
موقعیتهای میانگین
علامتها مکانهای میانگین عمل توپدار بازیکنان با تعداد کافی عمل را نشان میدهند. این نمودار چیدمان از تخته نیست — بلکه خلاصه فضایی از محل درگیریها است.
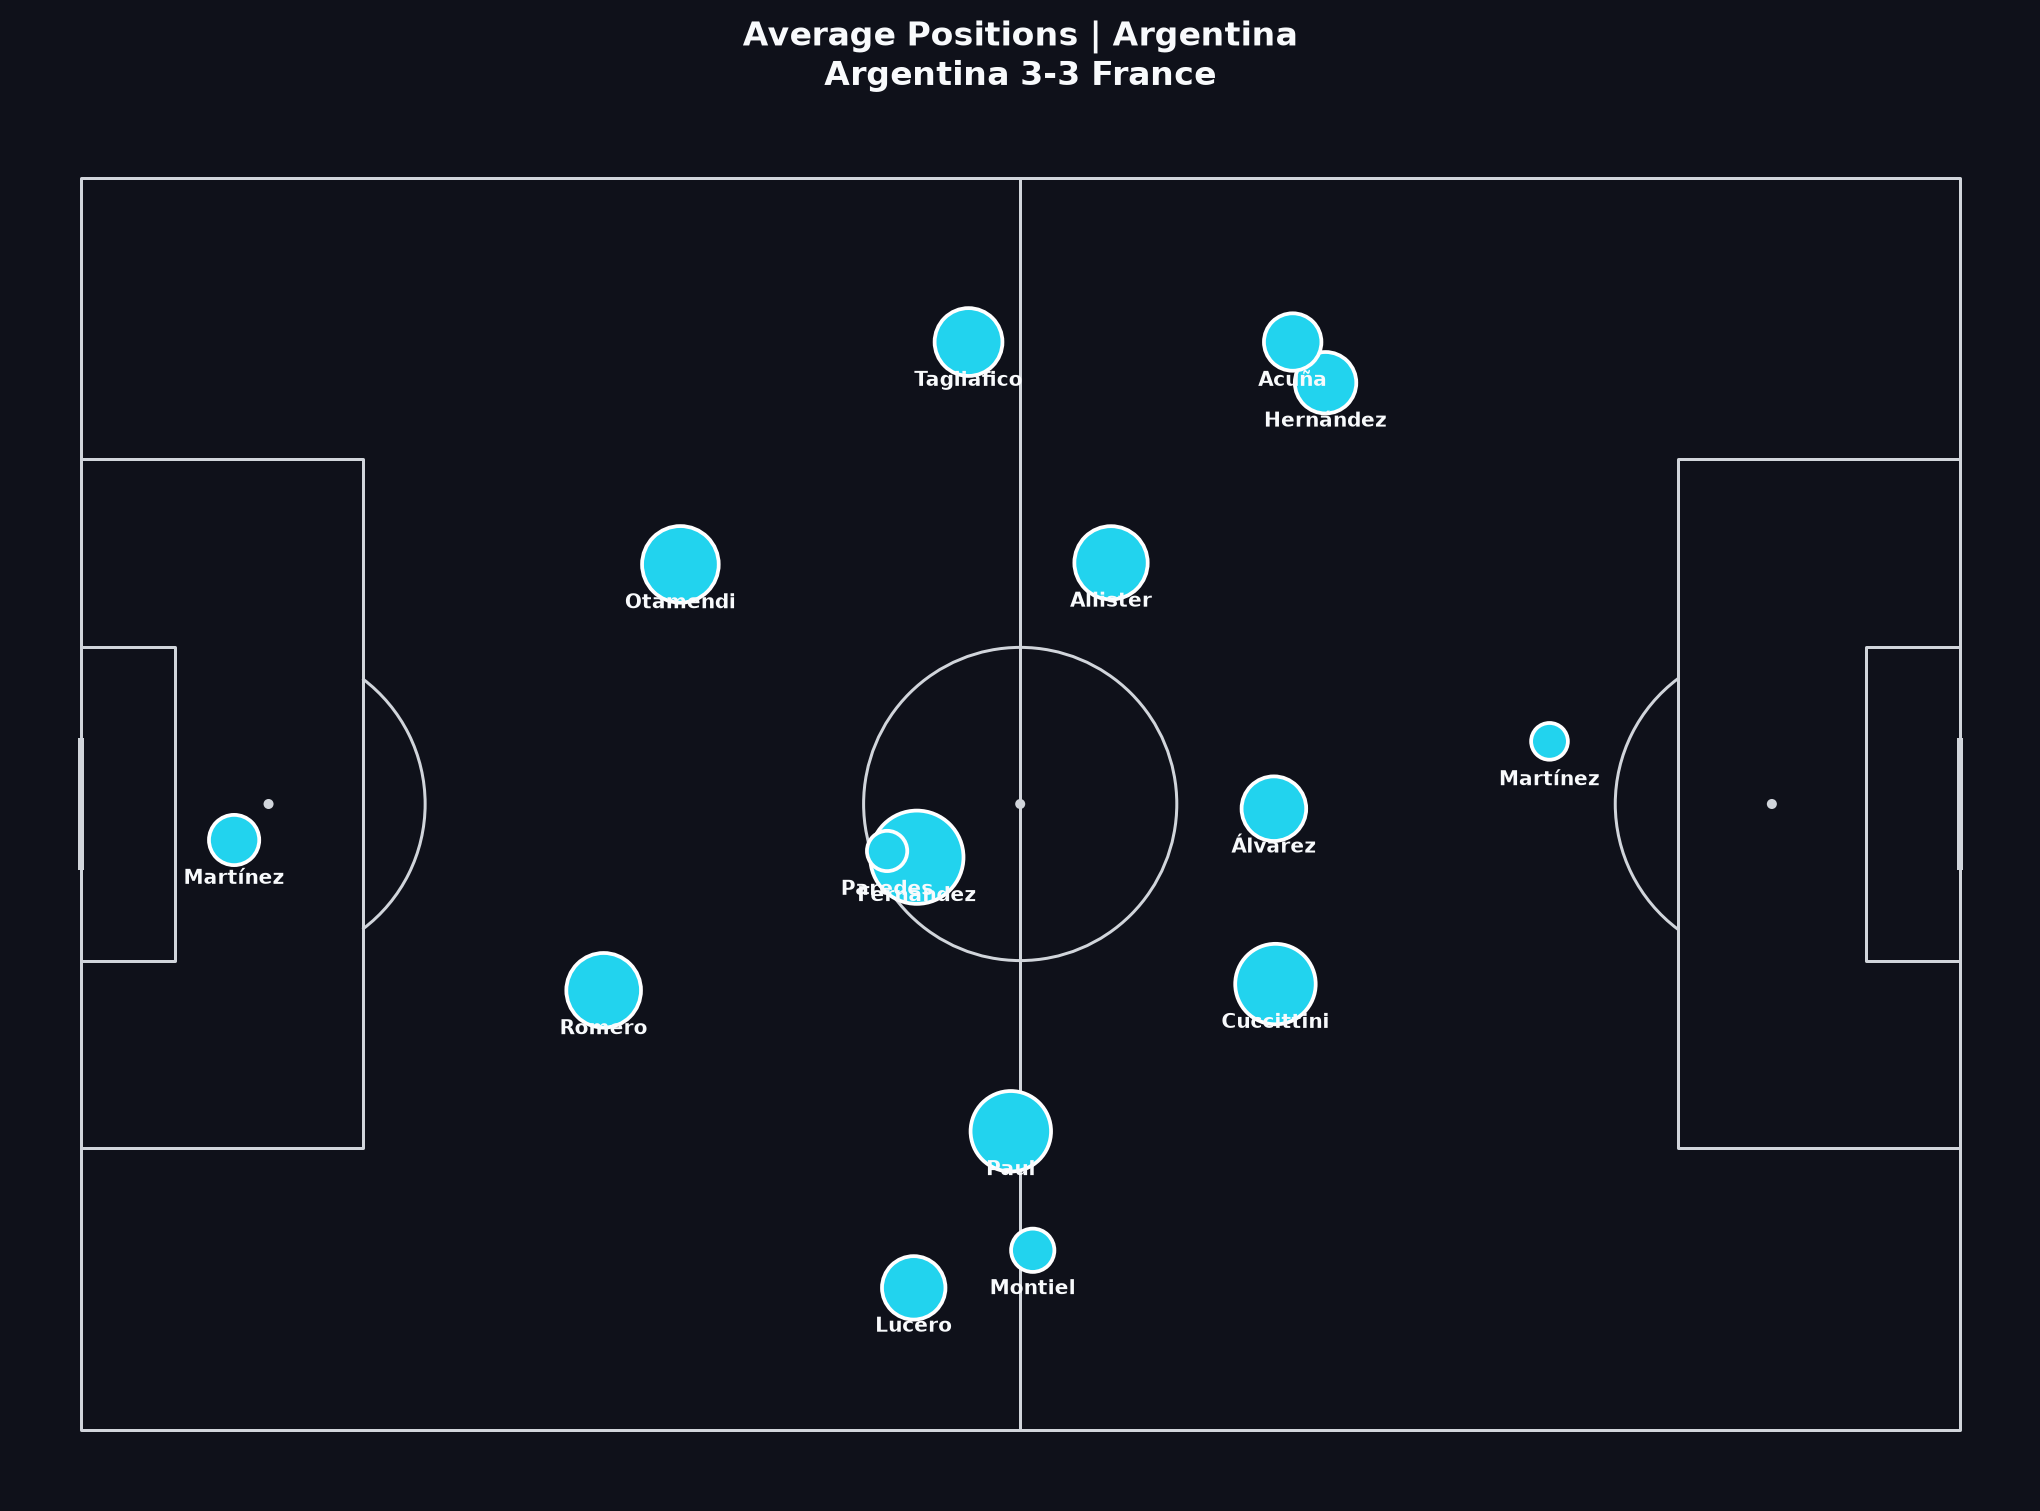
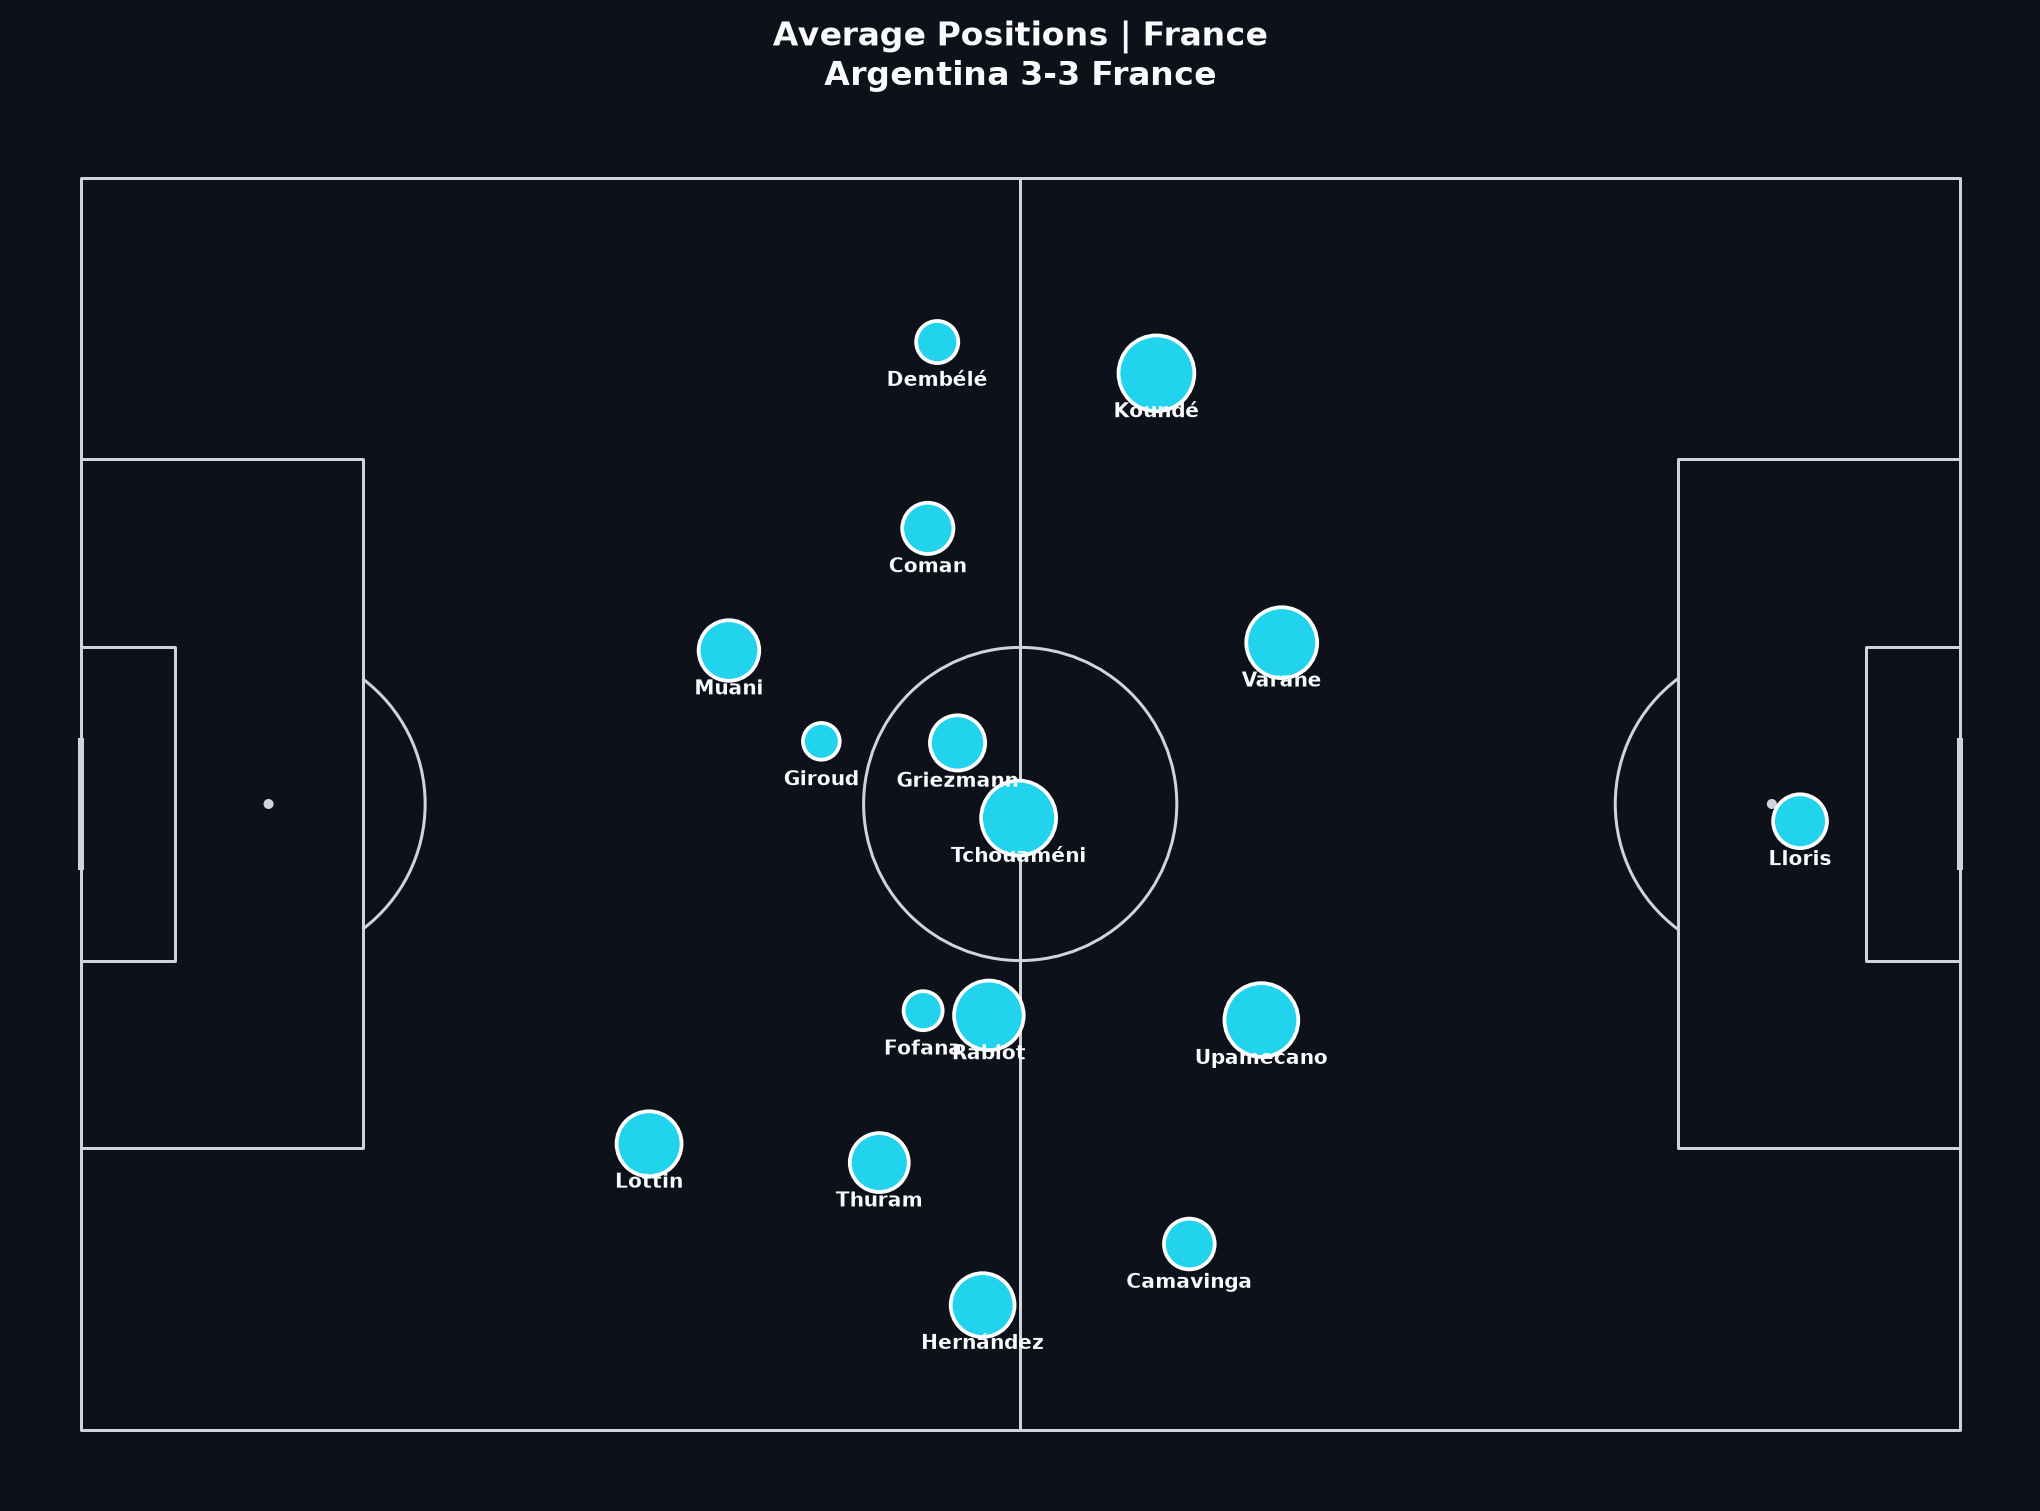
چگونه این را بخوانید
نکات تفصیلی «چگونه بخوانید» به انگلیسی است.
- Average position ≠ tactical role for every second. A full-back who inverts late will still leave a trail of earlier wide actions in the average.
- Use the plot to form hypotheses about height of engagement and central occupation, then test them on video clips.
- Compare the two sides’ vertical height. A higher average block can indicate territorial dominance or chasing a deficit — match state matters.
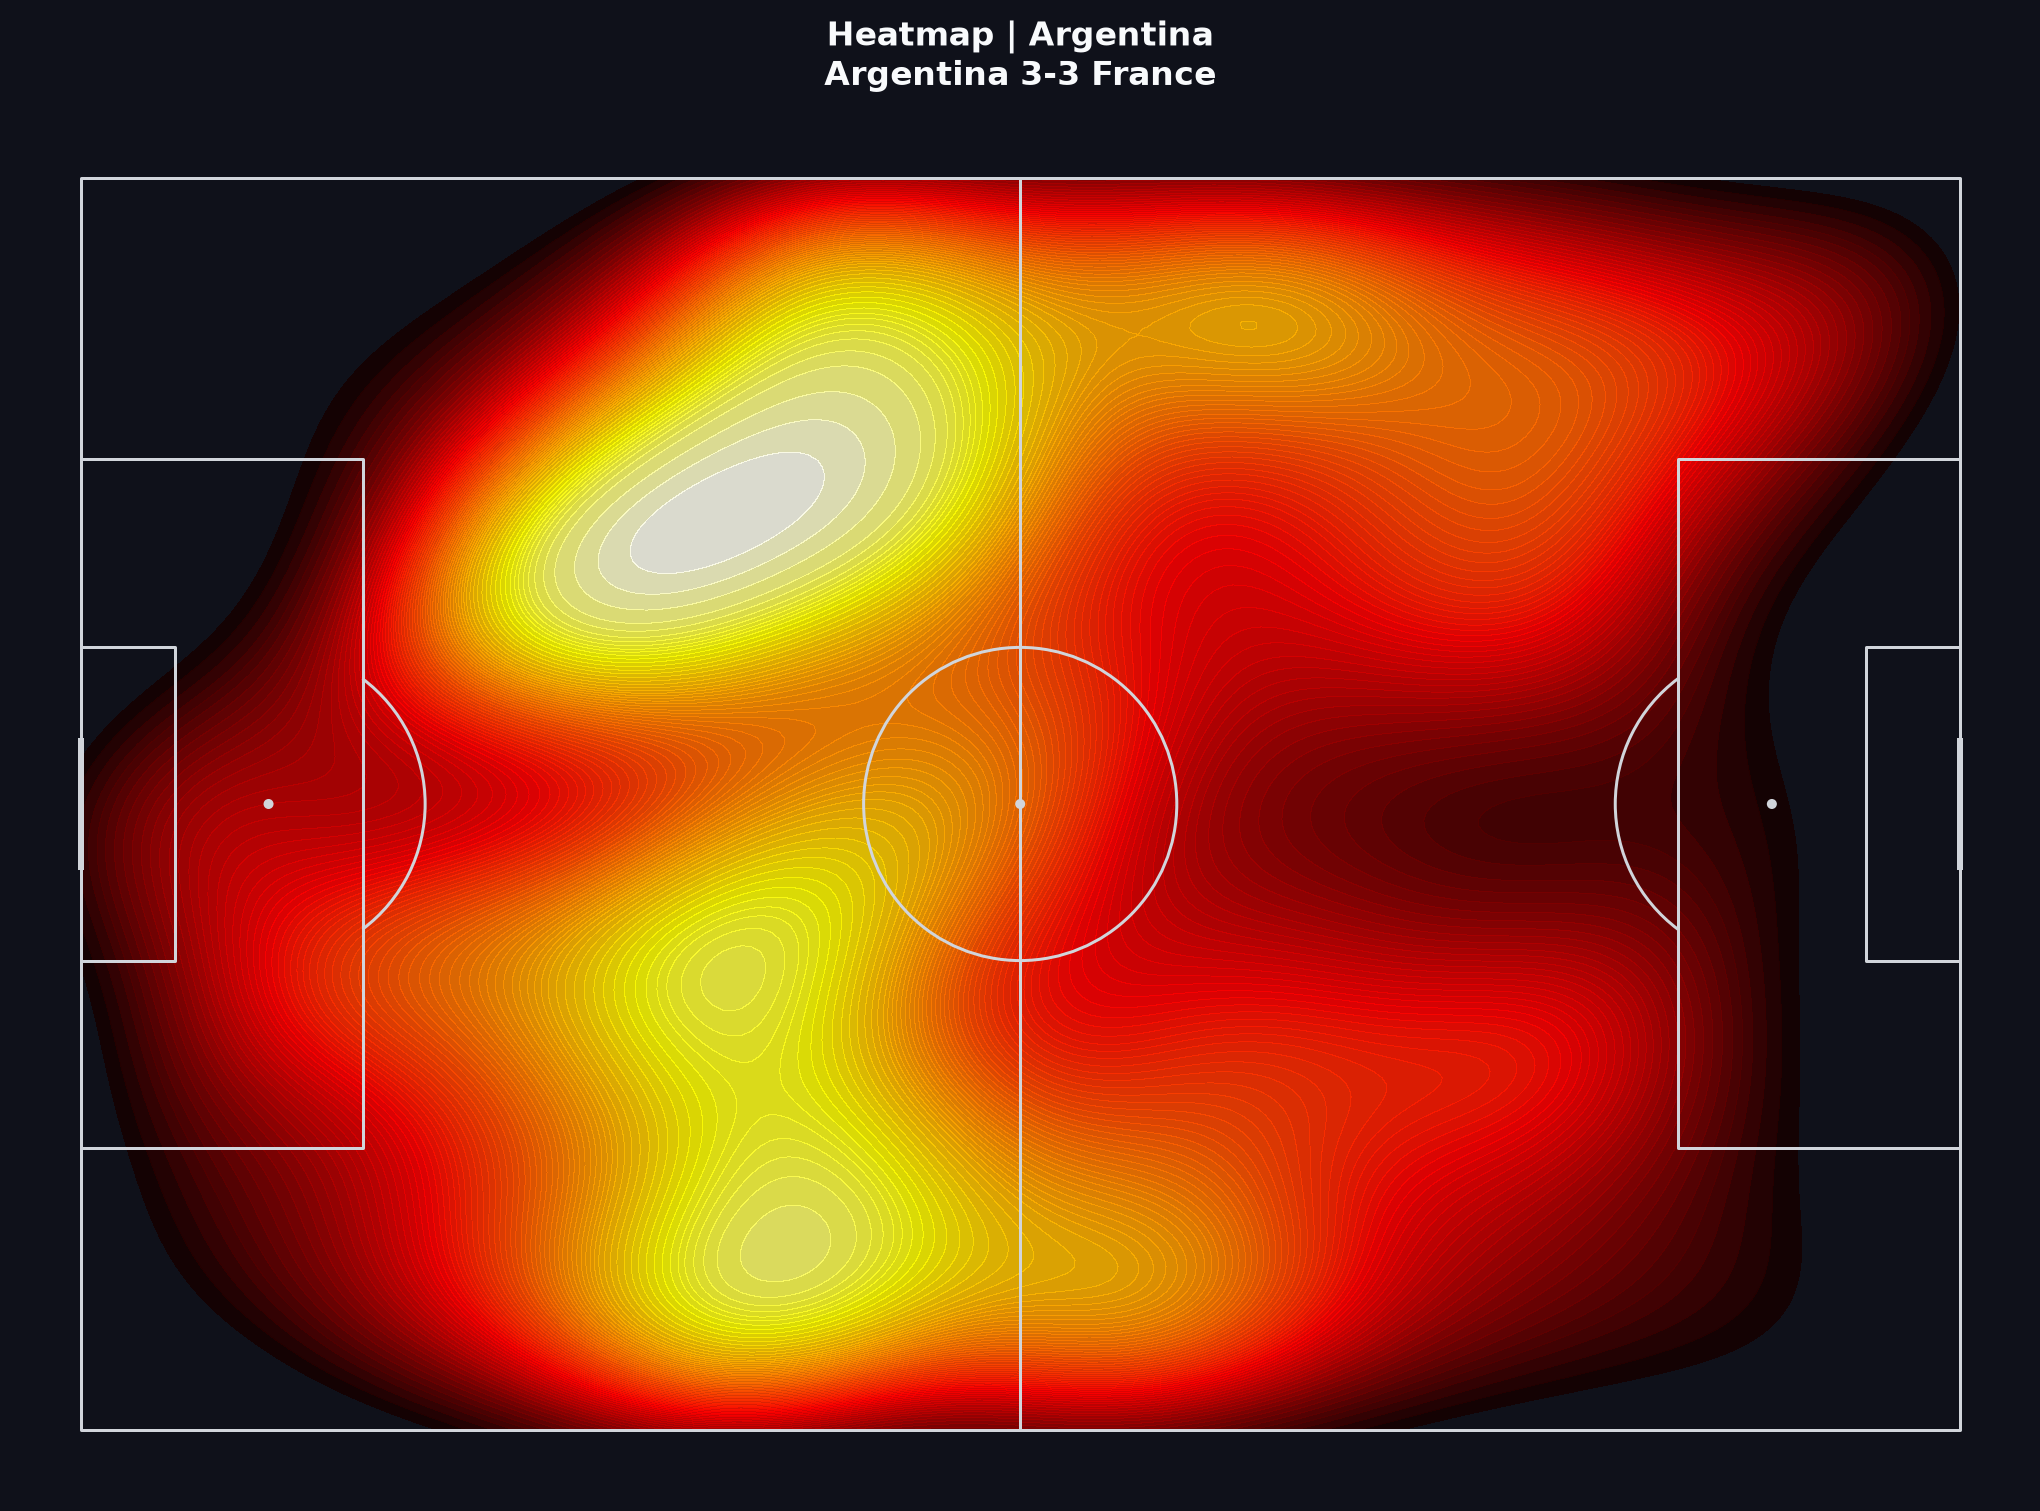
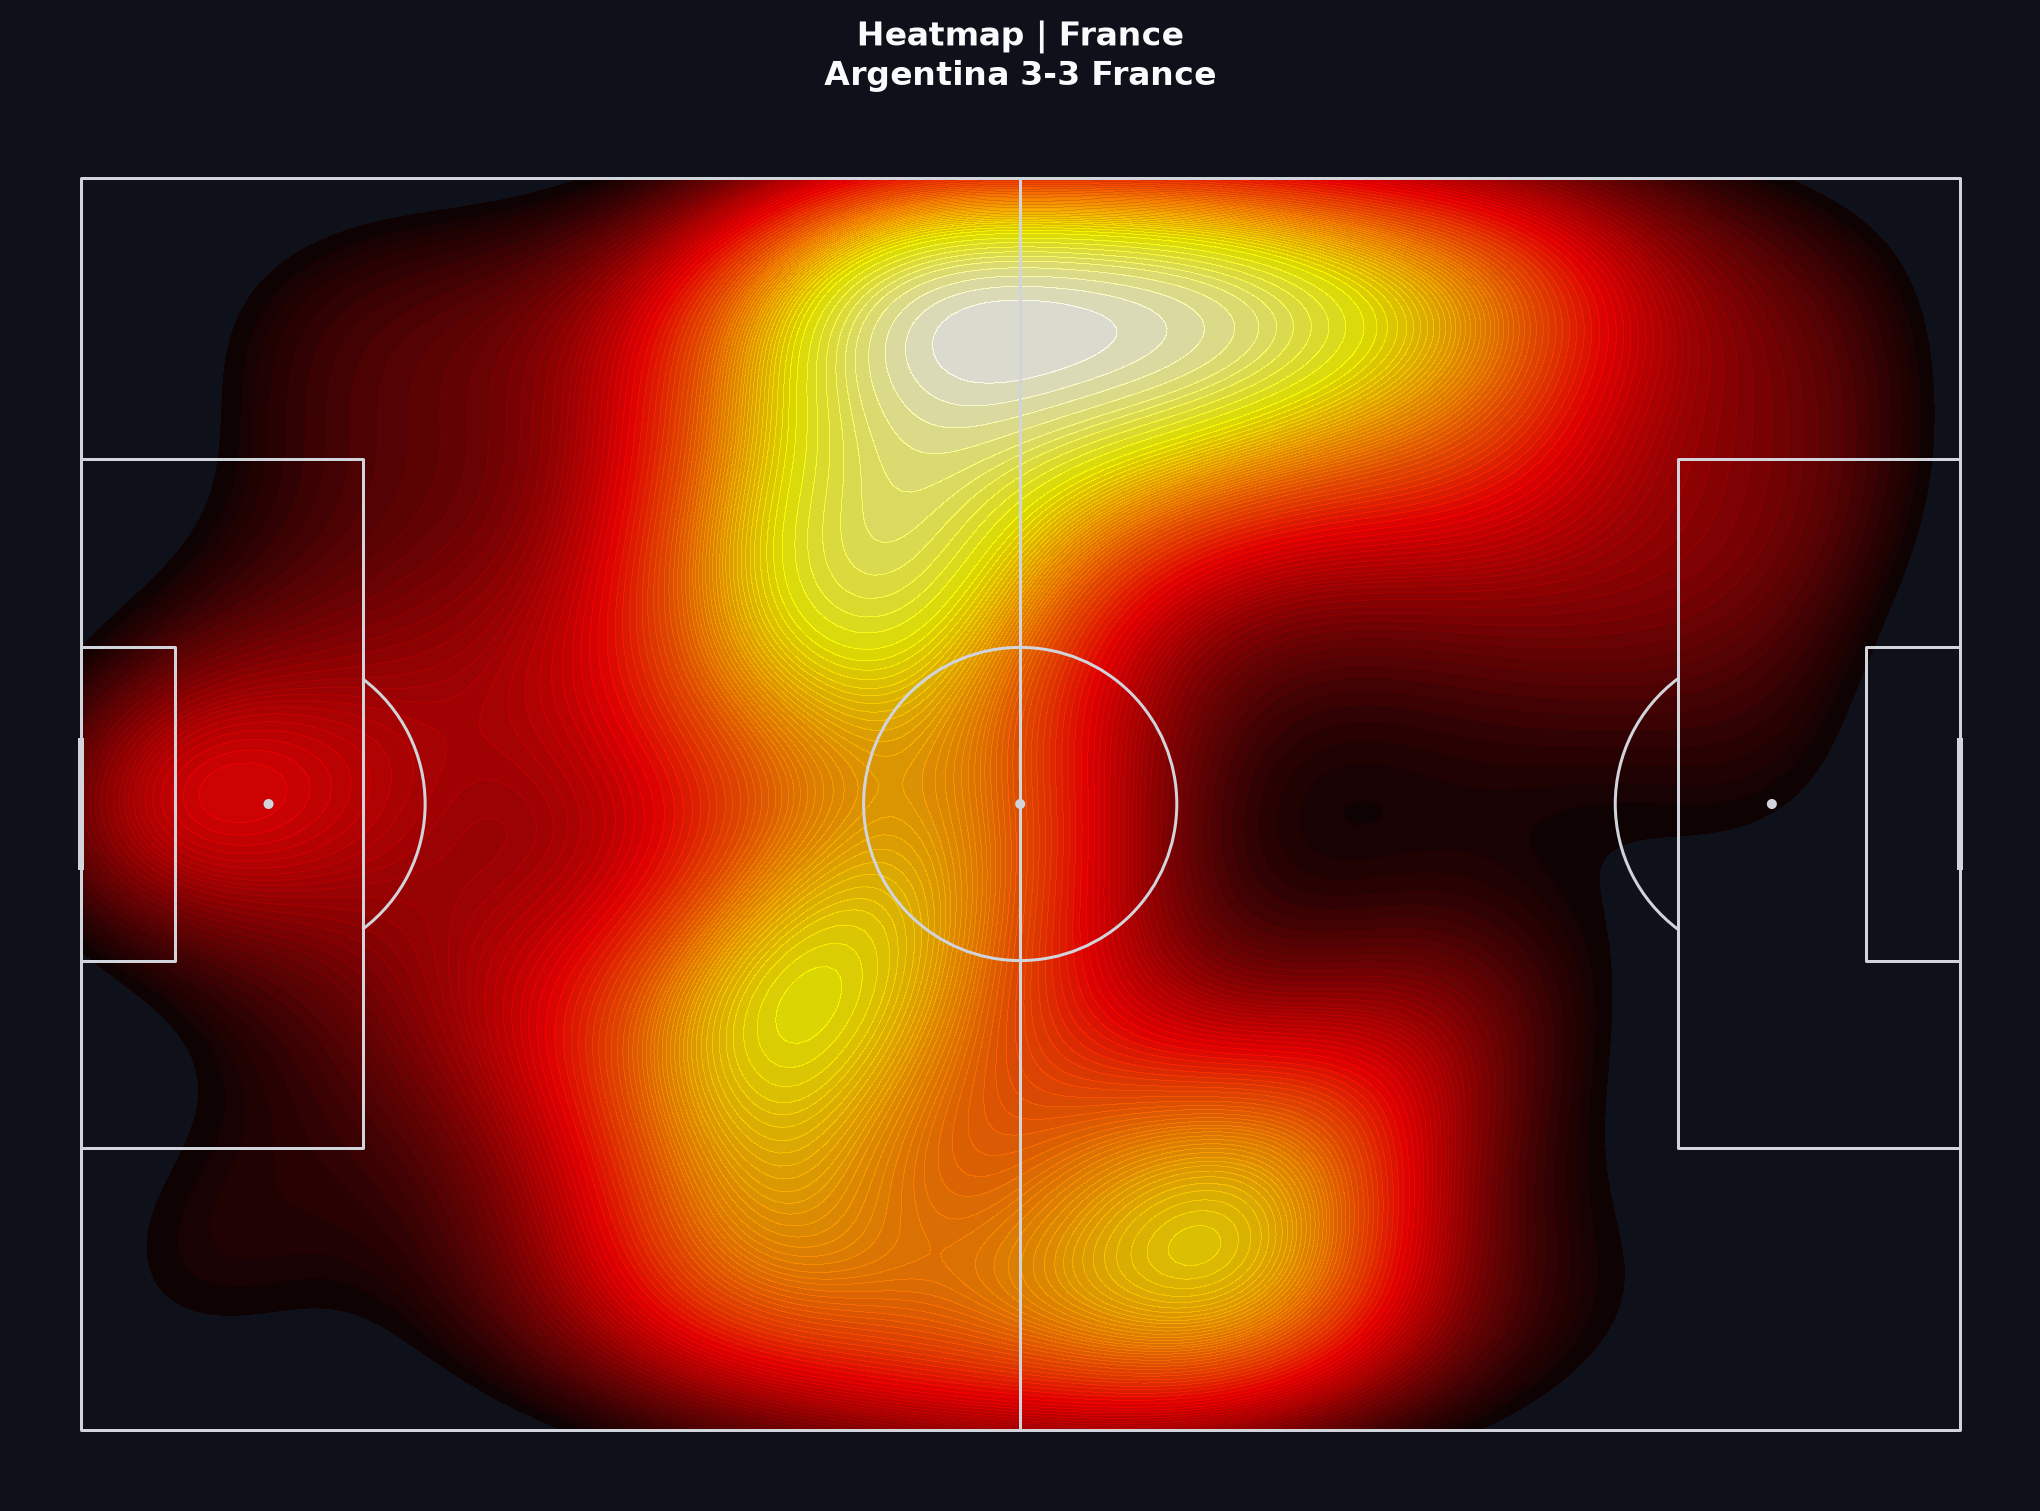
- Heatmaps (linked assets in the folder) show density of actions; average positions compress that density into one point per player. Use both ideas, not one alone.
درسهای مرتبط Learn
جمعبندی
بخش جمعبندی برای دقت به انگلیسی مانده است.
A responsible short report on this final would state the question (for example: how Argentina controlled progression before France’s late surge), show evidence by layer (network → progressive passes → shots), and keep the shoot-out analytically separate.
If you are following the Learn path, write five sentences using only claims these visuals can support — then note what still requires video.
تمرین نوشتاری
در ۱۵۰ تا ۲۰۰ کلمه: (۱) یک ادعا درباره پیشروی آرژانتین، (۲) یک ادعا درباره کیفیت یا زمانبندی موقعیتهای فرانسه، (۳) یک محدودیت دادههای رویداد در این مسابقه. هر ادعا را به یکی از تصاویر بالا مرتبط کنید.
Event data from StatsBomb’s public World Cup 2022 release. Coordinates use StatsBomb’s pitch model.