
मैच लैब / FIFA विश्व कप 2022
फाइनल · 2022-12-18
अर्जेंटीना 3–3 फ्रांस
अतिरिक्त समय के बाद · अर्जेंटीना ने पेनल्टी पर जीत हासिल की
लुसैल स्टेडियम · StatsBomb Open Data
शीर्षक और सार स्थानीयकृत हैं। नीचे विस्तृत पढ़ने के मार्गदर्शक सटीकता के लिए अंग्रेज़ी में हैं।
यह मैच सीखने के लिए उपयोगी क्यों है
- यह मैच प्रसिद्ध है, इसलिए शिक्षार्थी पहले से कहानी जानते हैं — जिससे कहानी और साक्ष्य को अलग करना आसान होता है।
- मौकों का सृजन हाफ और अतिरिक्त समय में असमान था। यह चरण के अनुसार शॉट मैप को सावधानी से पढ़ने के लिए मजबूर करता है, केवल अंतिम स्कोर से नहीं।
- अर्जेंटीना का पास नेटवर्क और प्रोग्रेसिव-पास मैप संरचित प्रगति दिखाते हैं; फ्रांस की देर से प्रतिक्रिया दिखाती है कि कैसे मैच की स्थिति तस्वीर बदल सकती है बिना पहले की प्रक्रिया को फिर से लिखे।
- पेनल्टी शूट-आउट खुले डेटा फाइल के अवधि 5 में होता है। शूट-आउट शॉट्स को खुले खेल के xG में मिलाना एक सामान्य गलती है जिसे यह मैच उजागर करता है।
मैच संदर्भ
अर्जेंटीना ने 2–0 की बढ़त बनाई, फ्रांस ने सामान्य समय के अंत में बराबरी की, और दोनों टीमों ने अतिरिक्त समय में फिर से गोल किए (3–3)। फिर अर्जेंटीना ने शूट-आउट जीता।
शिक्षण के लिए, नियमित + अतिरिक्त समय (अवधि 1–4) को मैच प्रक्रिया माना जाए। अवधि 5 (पेनल्टी) एक अलग अभ्यास है: विशेष नियमों के तहत उच्च-xG प्रयास।
अवधि 1–4 (90 मिनट + अतिरिक्त समय)
नीचे दिए आंकड़े पेनल्टी शूट-आउट (अवधि 5) को शामिल नहीं करते ताकि प्रक्रिया पढ़ाई शूट-आउट xG से विकृत न हो।
- अर्जेंटीना
- 20 शॉट · 3 गोल · ~2.76 xG
- प्रोग्रेसिव पास: 130 (23.2% पास में से)
- फ्रांस
- 10 शॉट · 3 गोल · ~2.27 xG
- प्रोग्रेसिव पास: 56 (12.9% पास में से)
दृश्य 1
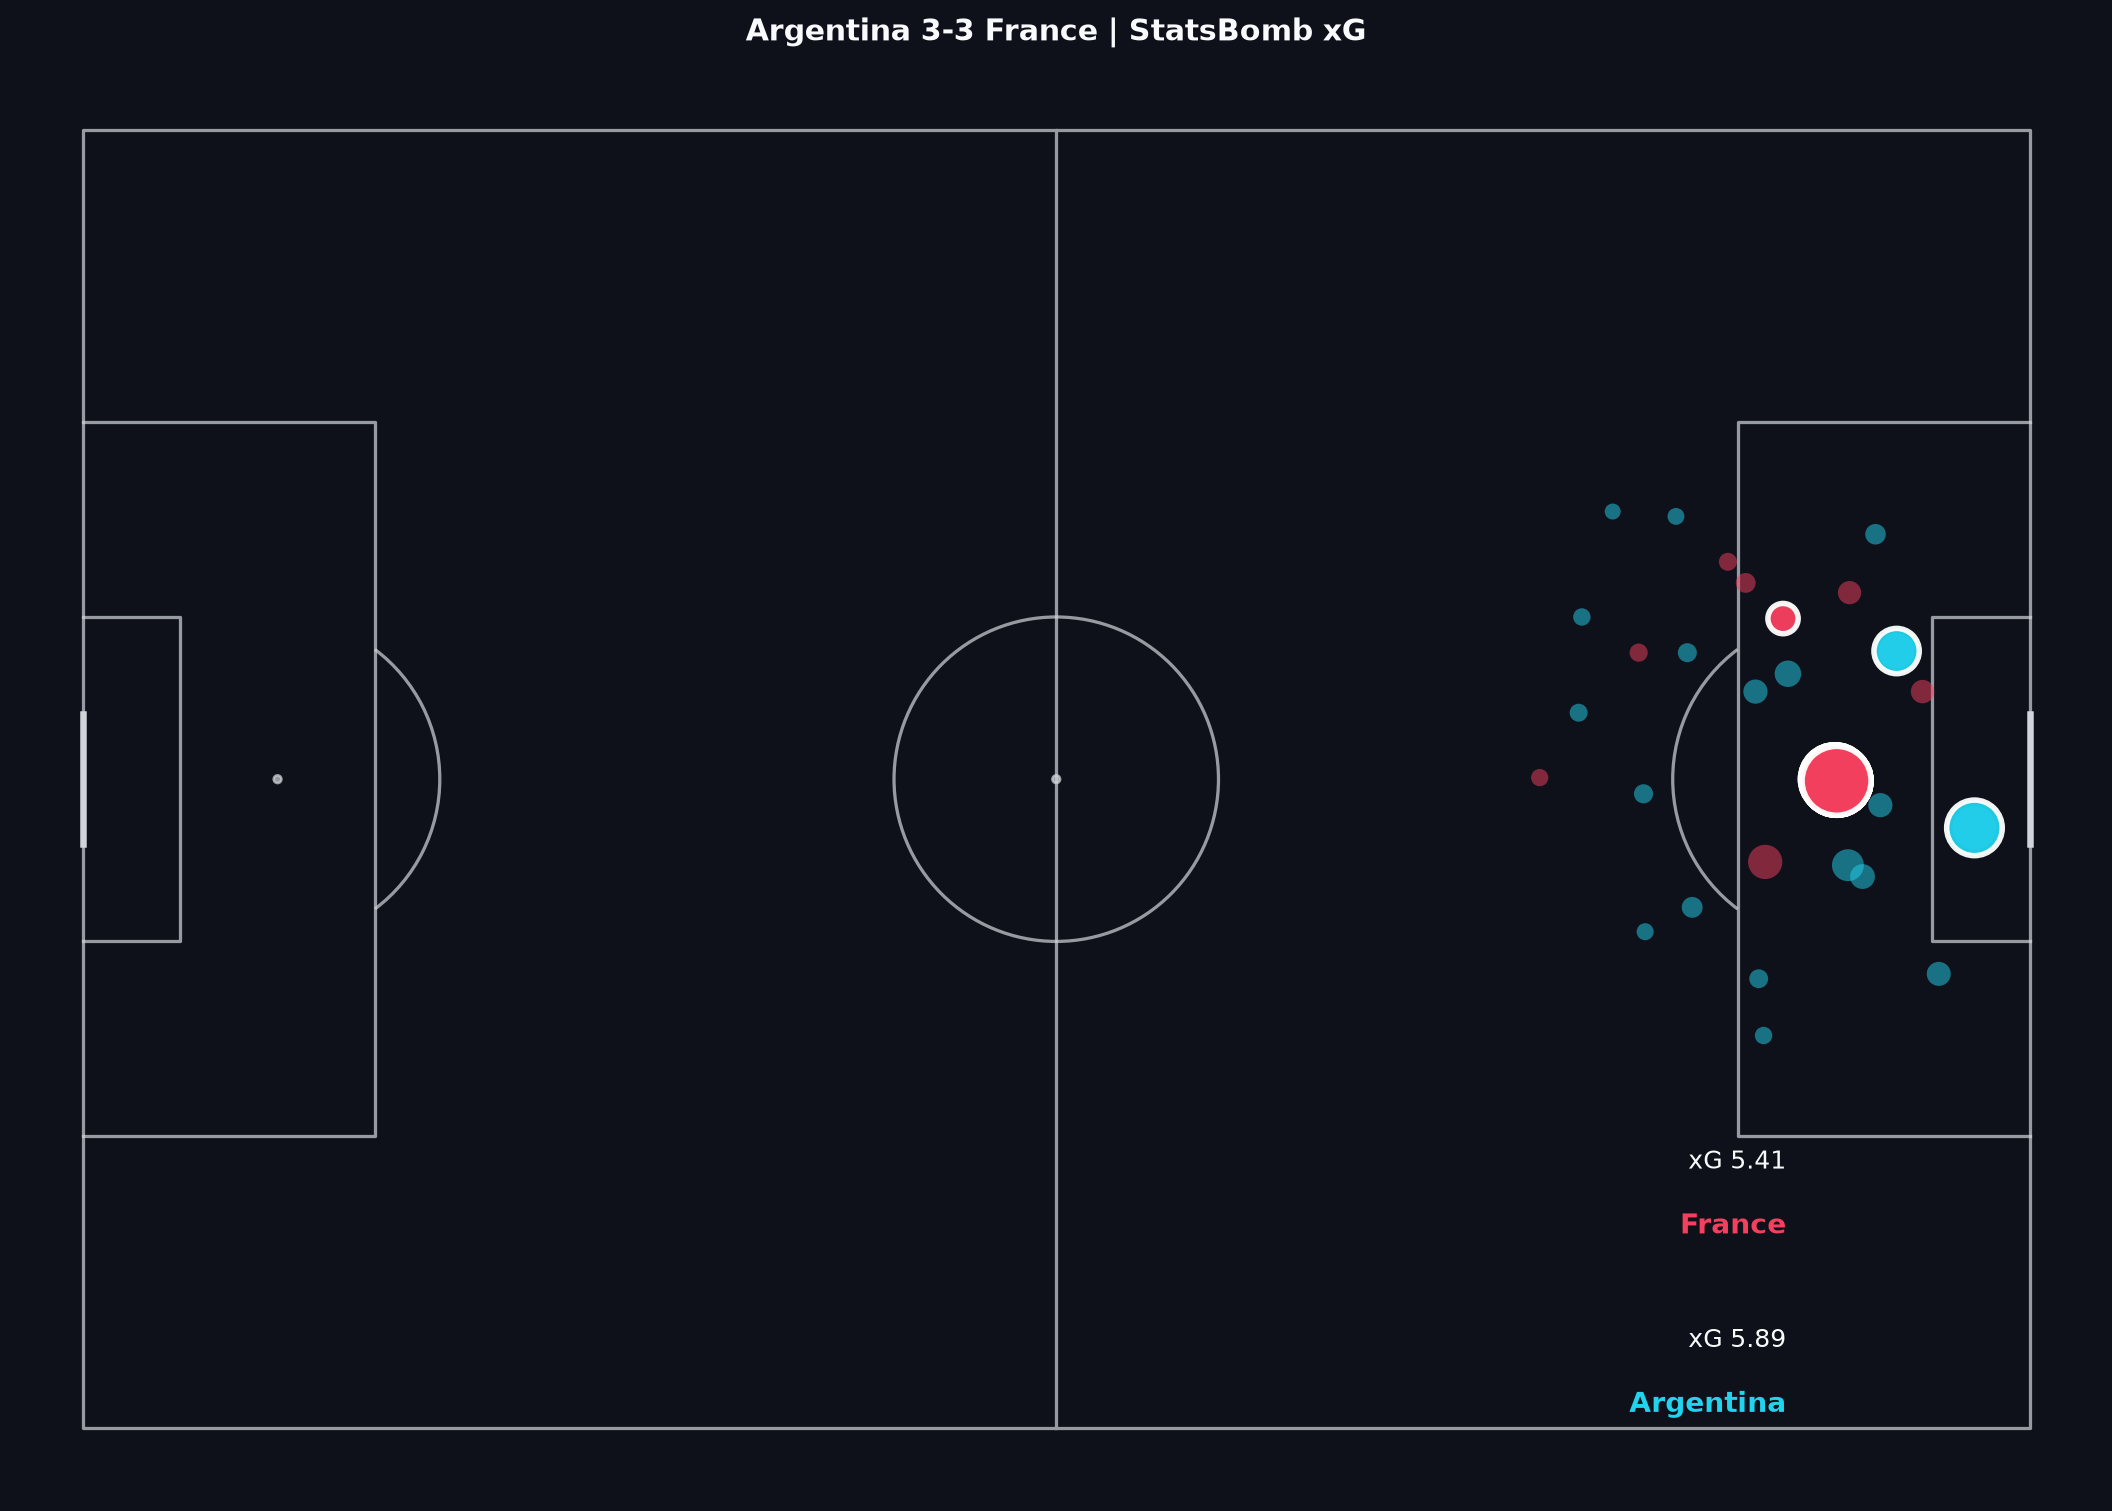
शॉट मैप
प्रत्येक मार्कर एक शॉट है। स्थान, मात्रा, और गुणवत्ता डॉट्स की गिनती से अधिक महत्वपूर्ण हैं। ऊपर दी गई अवधि की शर्त के साथ इस मैप को पढ़ें: पहले प्रक्रिया, फिर शूट-आउट।
इसे कैसे पढ़ें
विस्तृत “इसे कैसे पढ़ें” बुलेट अंग्रेज़ी में हैं।
- Start with location clusters, not the scoreline. Central box attempts usually carry more historical goal probability than speculative efforts from distance.
- Compare volume and quality together. Argentina recorded more shots in periods 1–4; France’s conversion relative to fewer attempts is part of the late-game story, not proof that earlier Argentine control ‘did not matter’.
- Ask which chances came from open play versus set pieces, and whether a cluster reflects sustained territorial pressure or a short burst.
- Do not invent a formation story the map cannot prove. A shot map shows outcomes of chances, not every off-ball run that created them.
संबंधित Learn पाठ
दृश्य 2
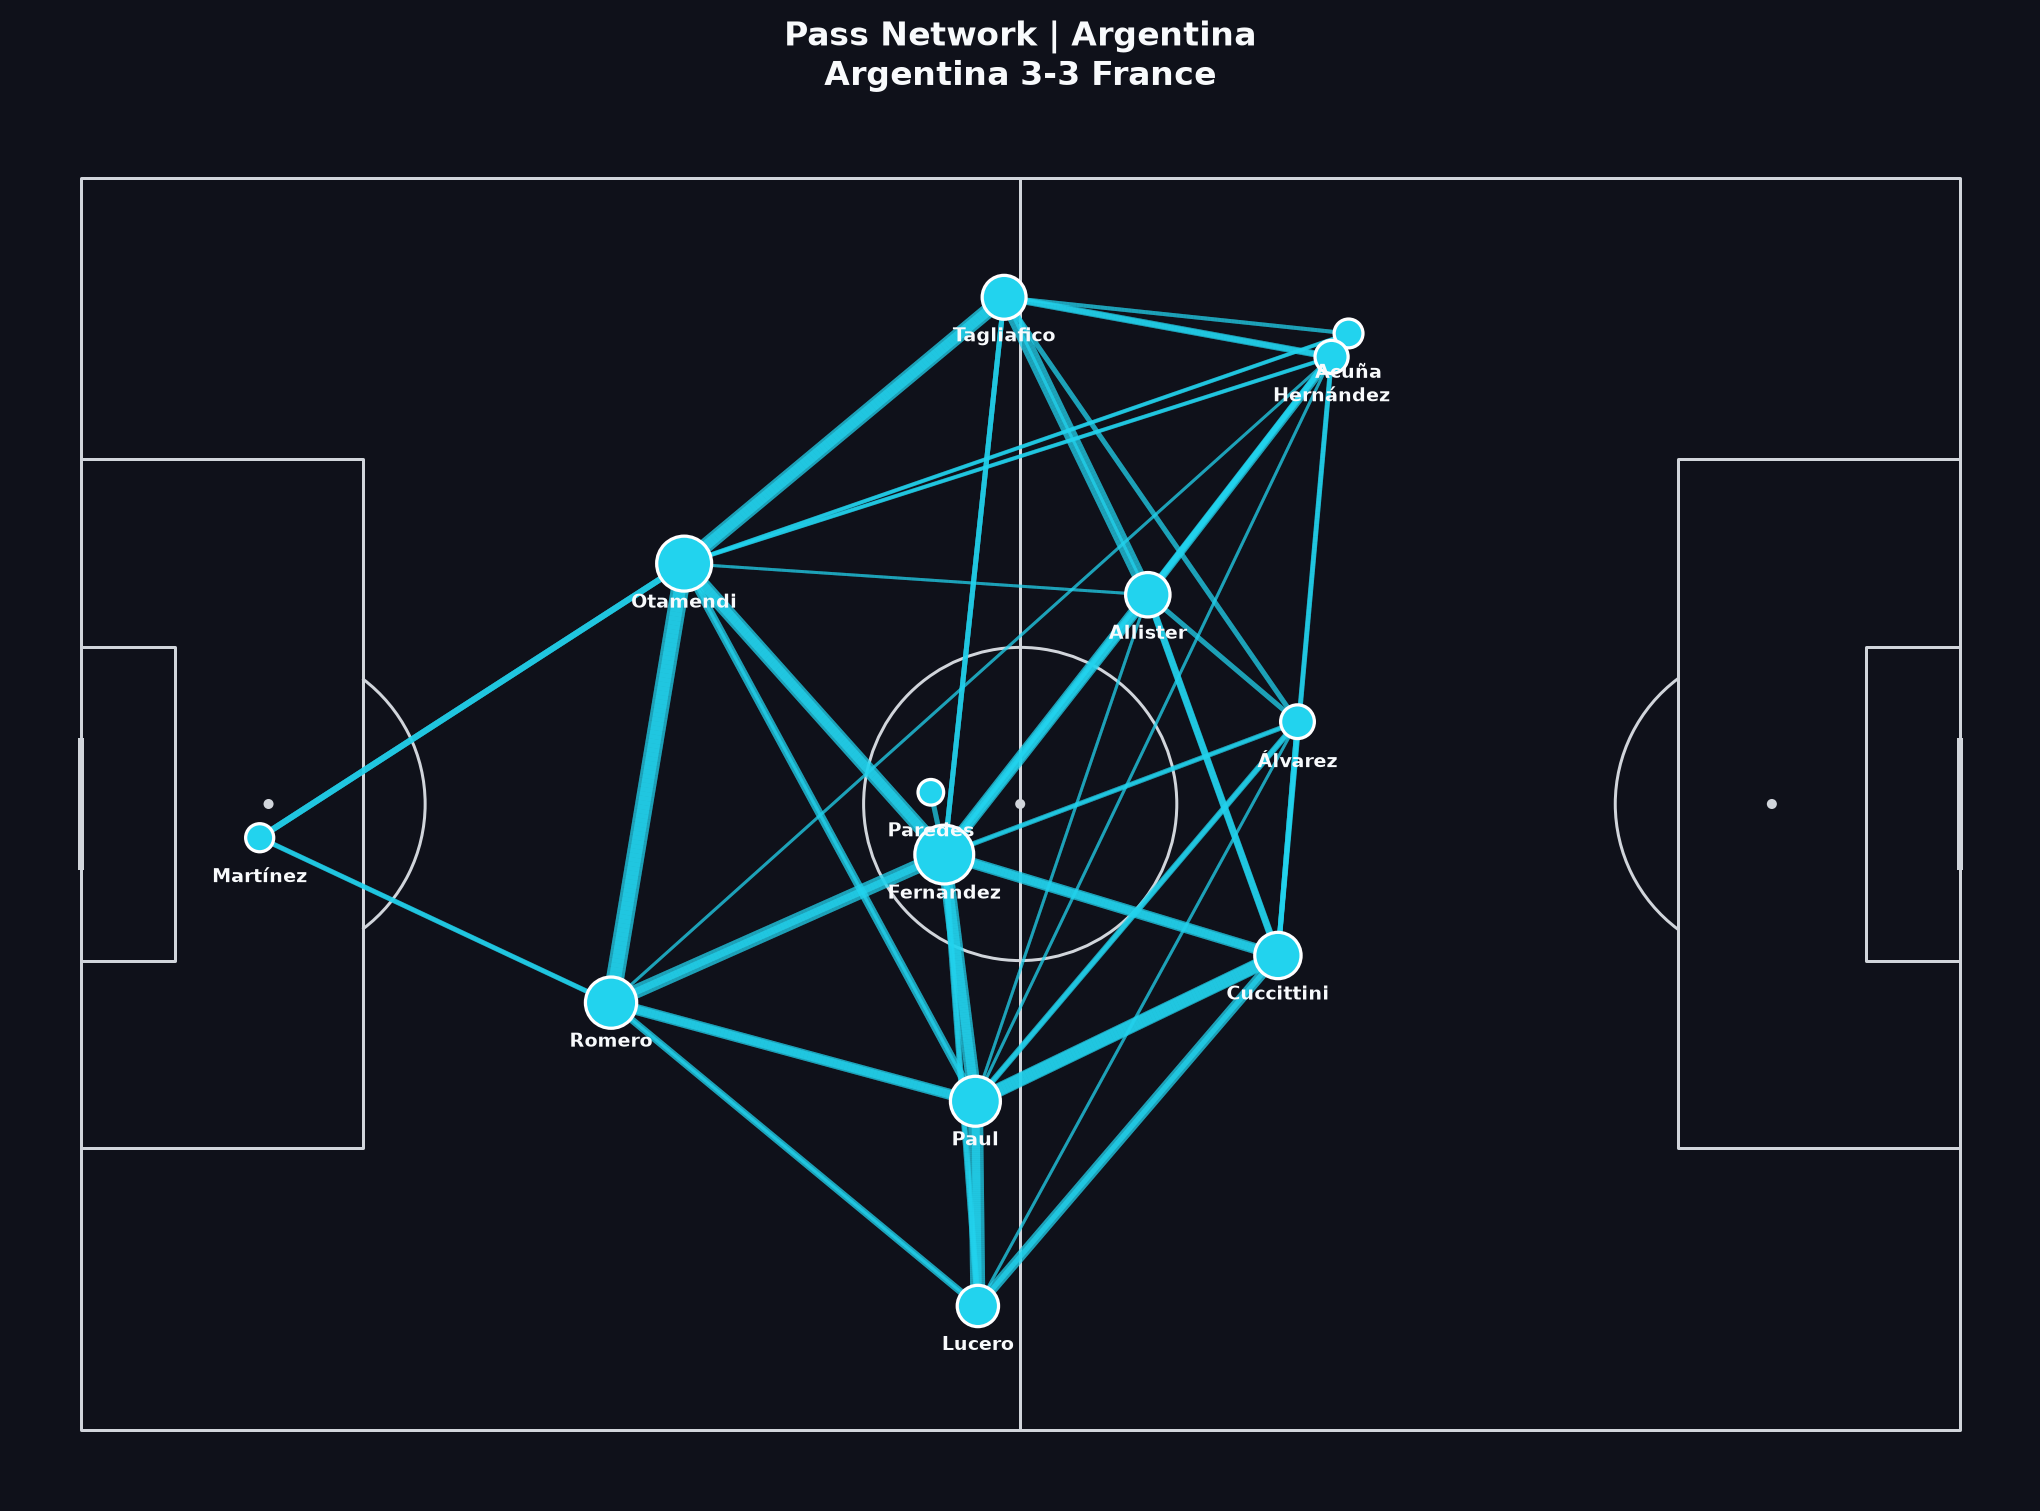
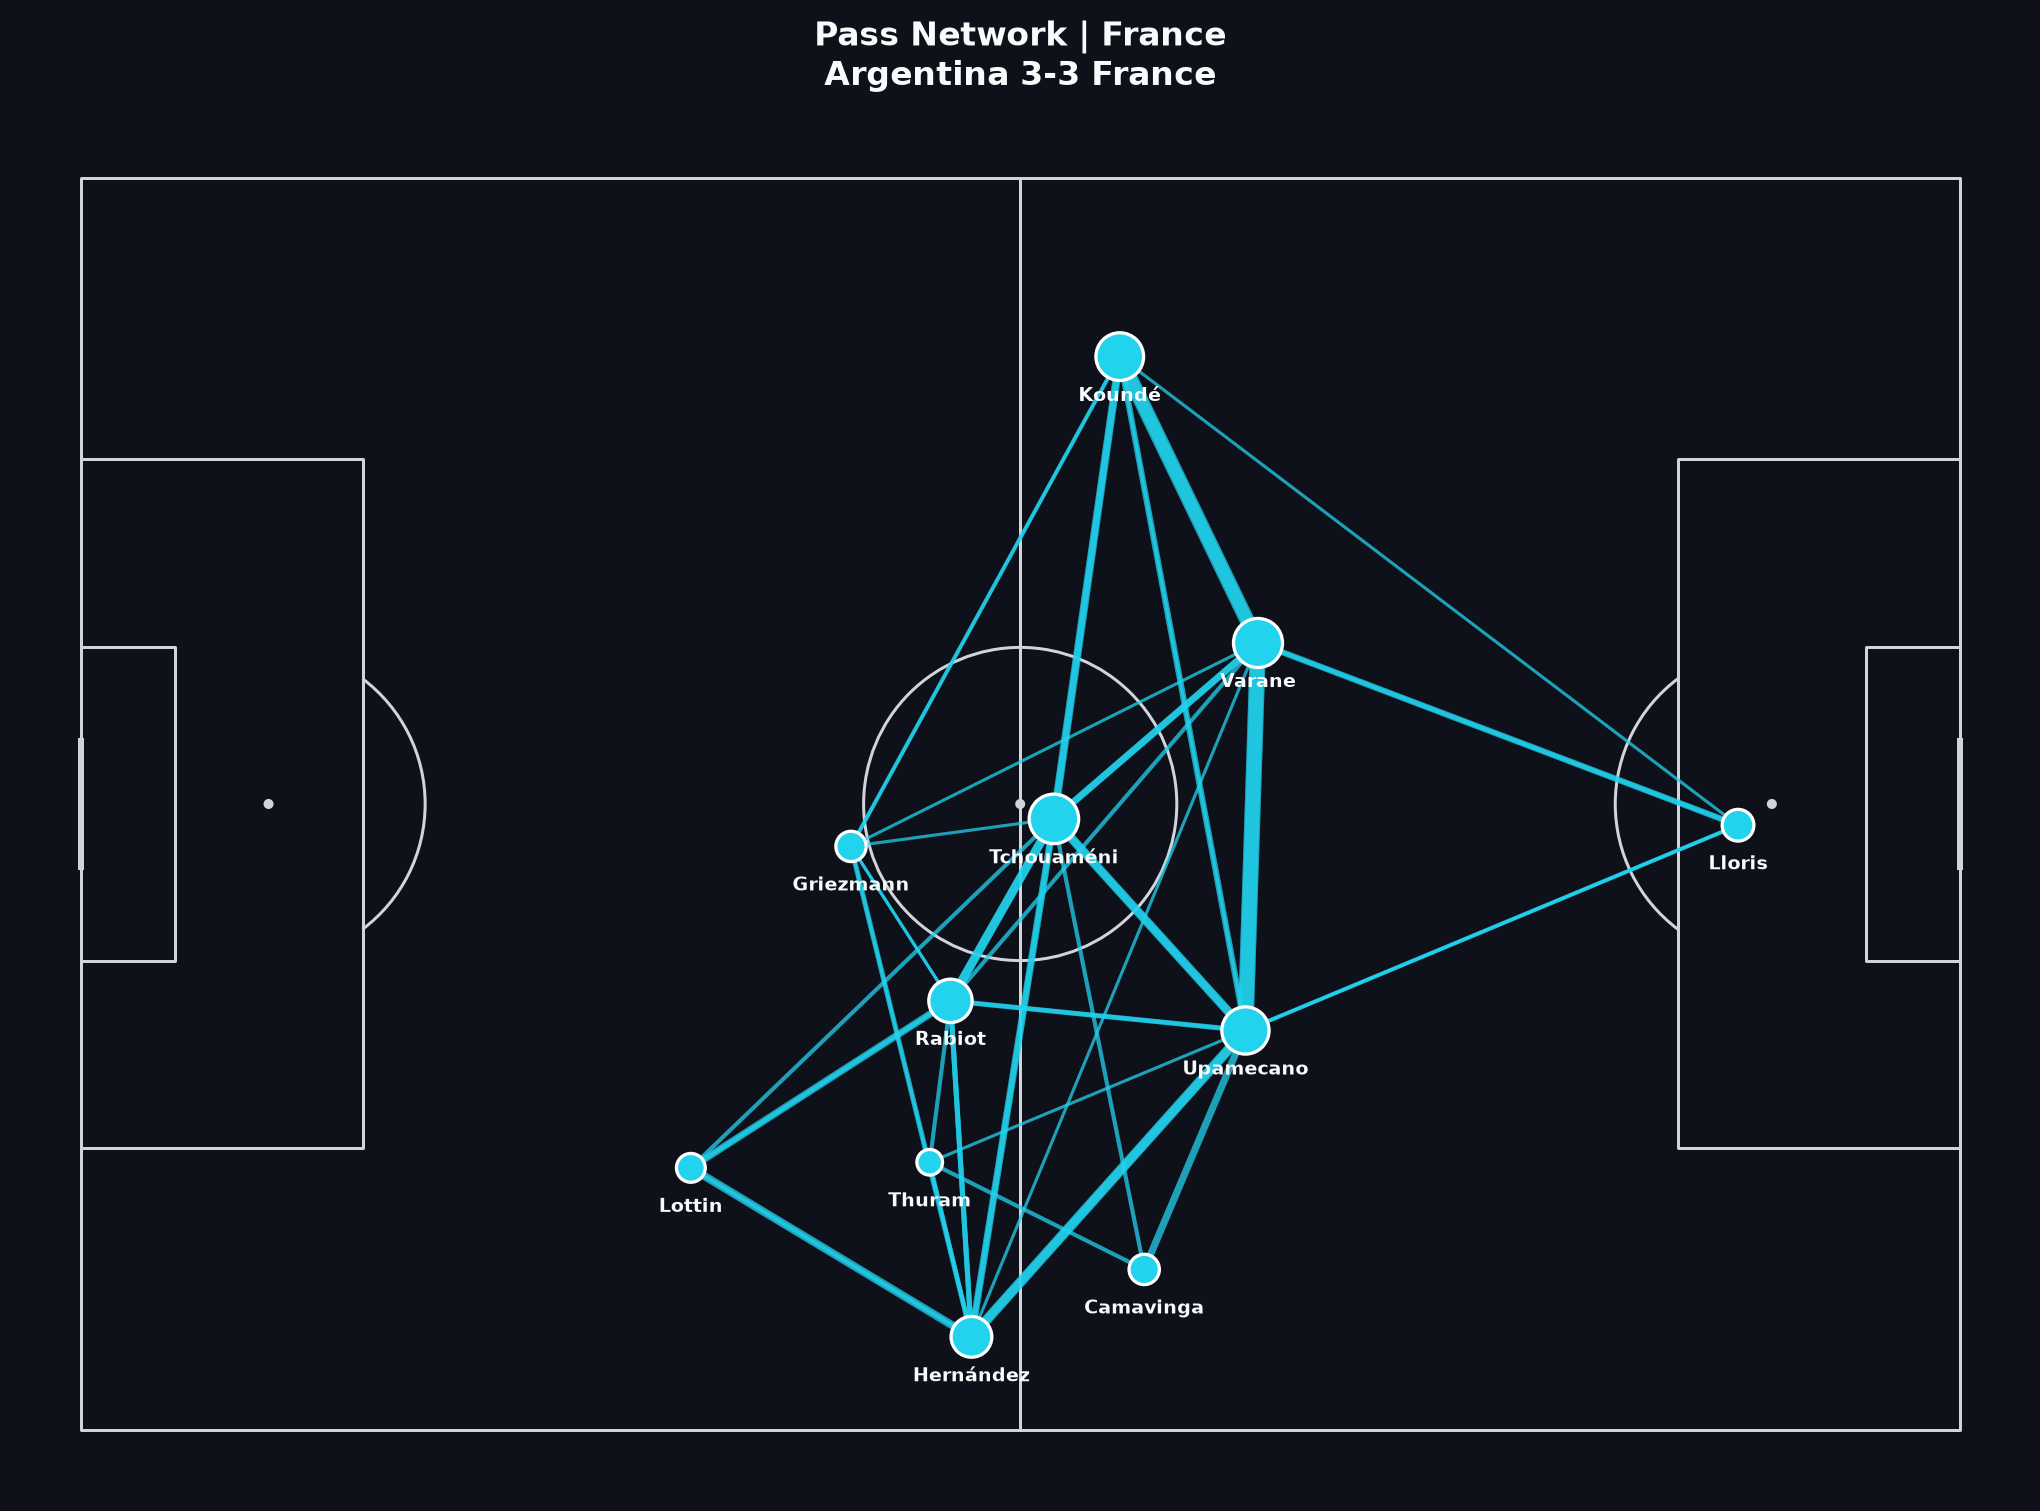
पास नेटवर्क
नोड खिलाड़ी हैं (औसत ऑन-बॉल स्थान); एज पूर्ण पास कनेक्शन दिखाते हैं। मोटे या मजबूत लिंक आमतौर पर अधिक बार संयोजन दिखाते हैं — जरूरी नहीं कि बेहतर फुटबॉल।
इसे कैसे पढ़ें
विस्तृत “इसे कैसे पढ़ें” बुलेट अंग्रेज़ी में हैं।
- Look for hubs and corridors. Who receives in central zones? Who connects the first line to the final third?
- A dense network on one flank can mean intentional overloads — or forced circulation away from pressure. Confirm with video before naming a ‘plan’.
- Compare Argentina’s denser progressive structure with France’s more selective connections. Difference in volume is informative; it is not a moral ranking.
- Substitutions and game state change networks. A final with long extra time mixes several match phases into one average picture.
संबंधित Learn पाठ
दृश्य 3
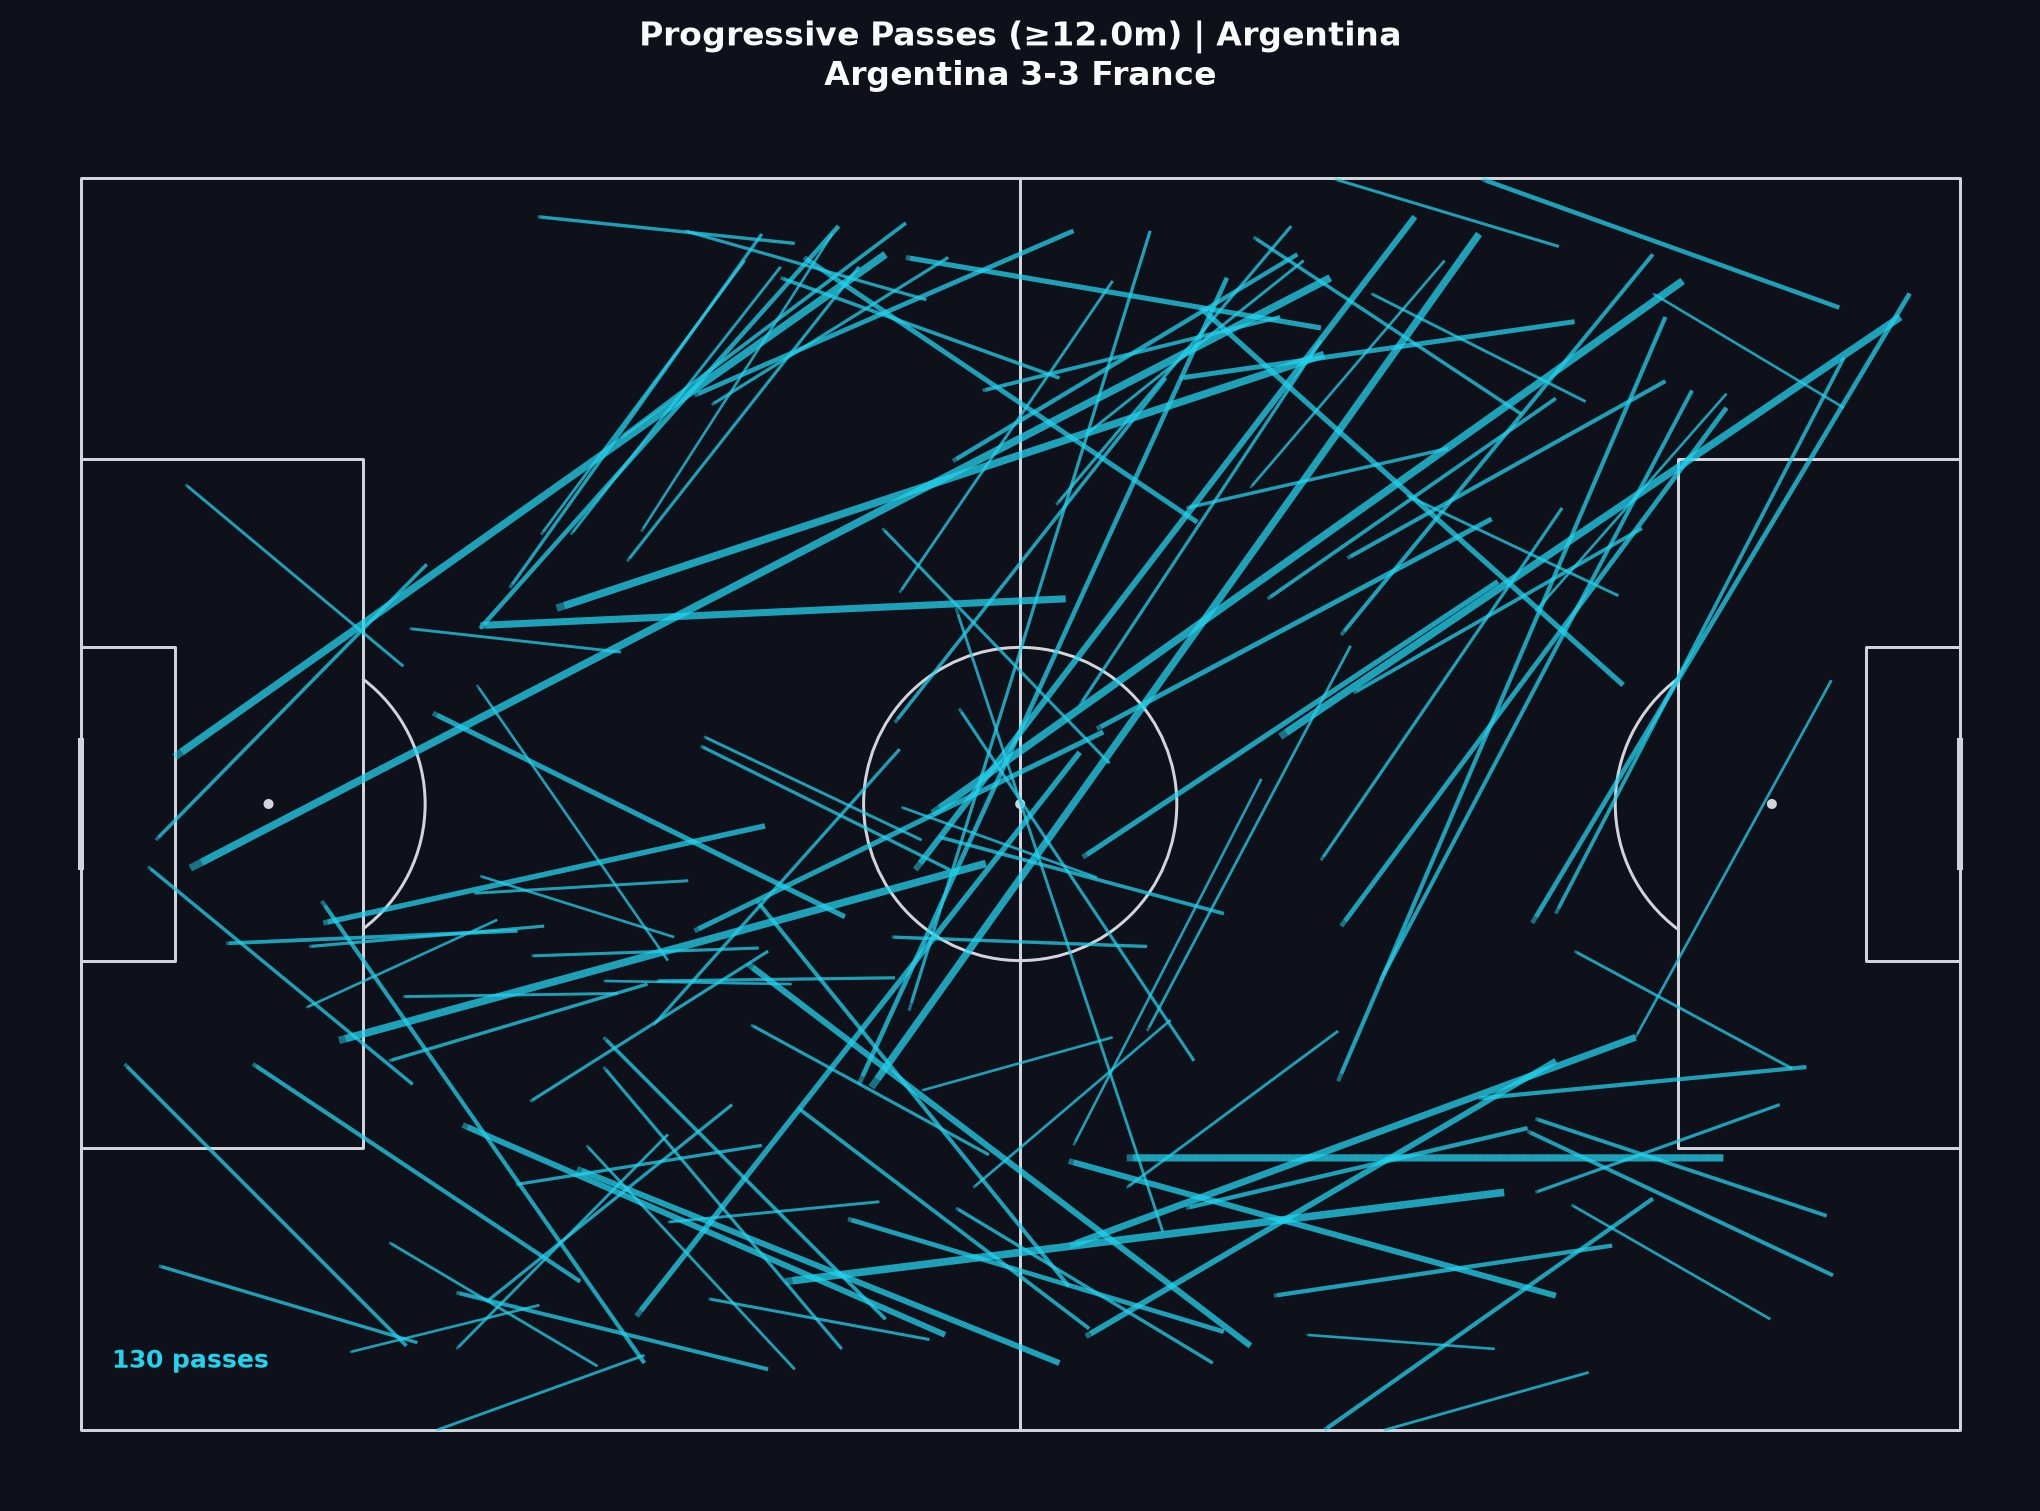
प्रोग्रेसिव पास
प्रोग्रेसिव पास गेंद को गोल की ओर सार्थक रूप से आगे बढ़ाते हैं (यहाँ: फुटबॉल-एआई परिभाषा के तहत लगभग 12 मीटर की प्रगति)। ये बेकार कब्जे को क्षेत्राधिकार से अलग करने में मदद करते हैं।
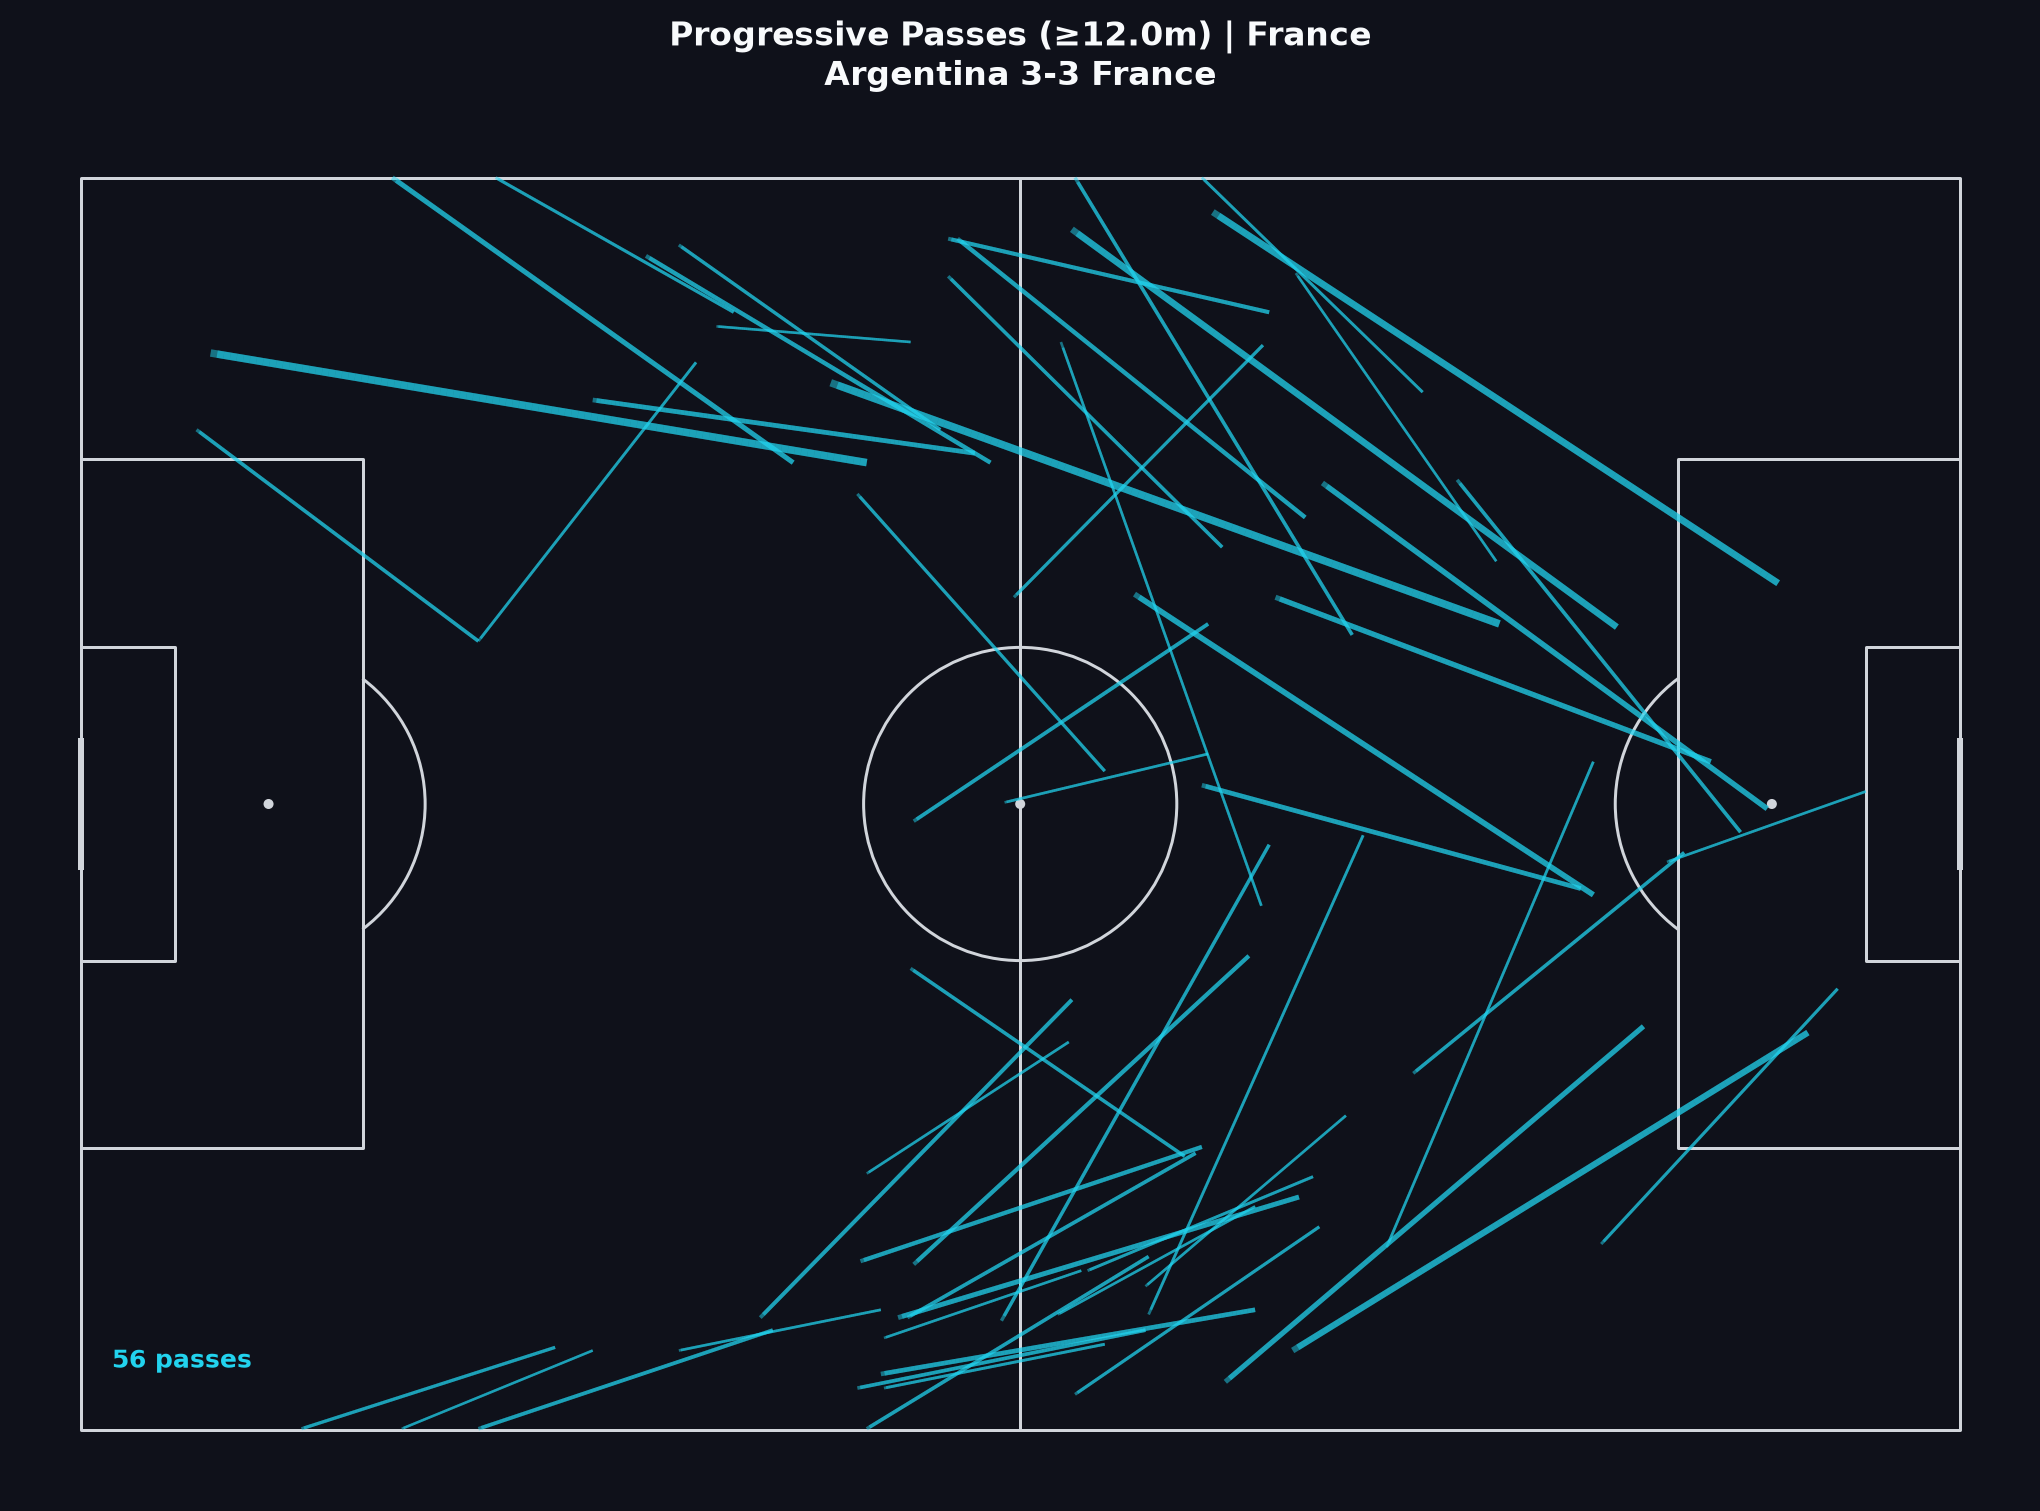
इसे कैसे पढ़ें
विस्तृत “इसे कैसे पढ़ें” बुलेट अंग्रेज़ी में हैं।
- High progressive volume suggests a team repeatedly advanced the ball; it does not guarantee high-quality shots at the end of those advances.
- Argentina’s progressive share (~23% of passes in this rendering) is substantially higher than France’s (~13%). Read that as a process difference across the match file, then ask when France’s dangerous moments arrived.
- Trace start and end zones. Progression into the half-space or box carries different tactical meaning from sideways progress near halfway.
- Pair this map with the shot map: progression without shots can be sterile control; shots without progression can be transition or set-piece dependent.
संबंधित Learn पाठ
दृश्य 4
औसत स्थान
मार्कर उन खिलाड़ियों के औसत ऑन-बॉल क्रिया स्थान दिखाते हैं जिनके पास पर्याप्त क्रियाएं हैं। यह कोई फॉर्मेशन डायग्राम नहीं है — यह भागीदारी का स्थानिक सारांश है।
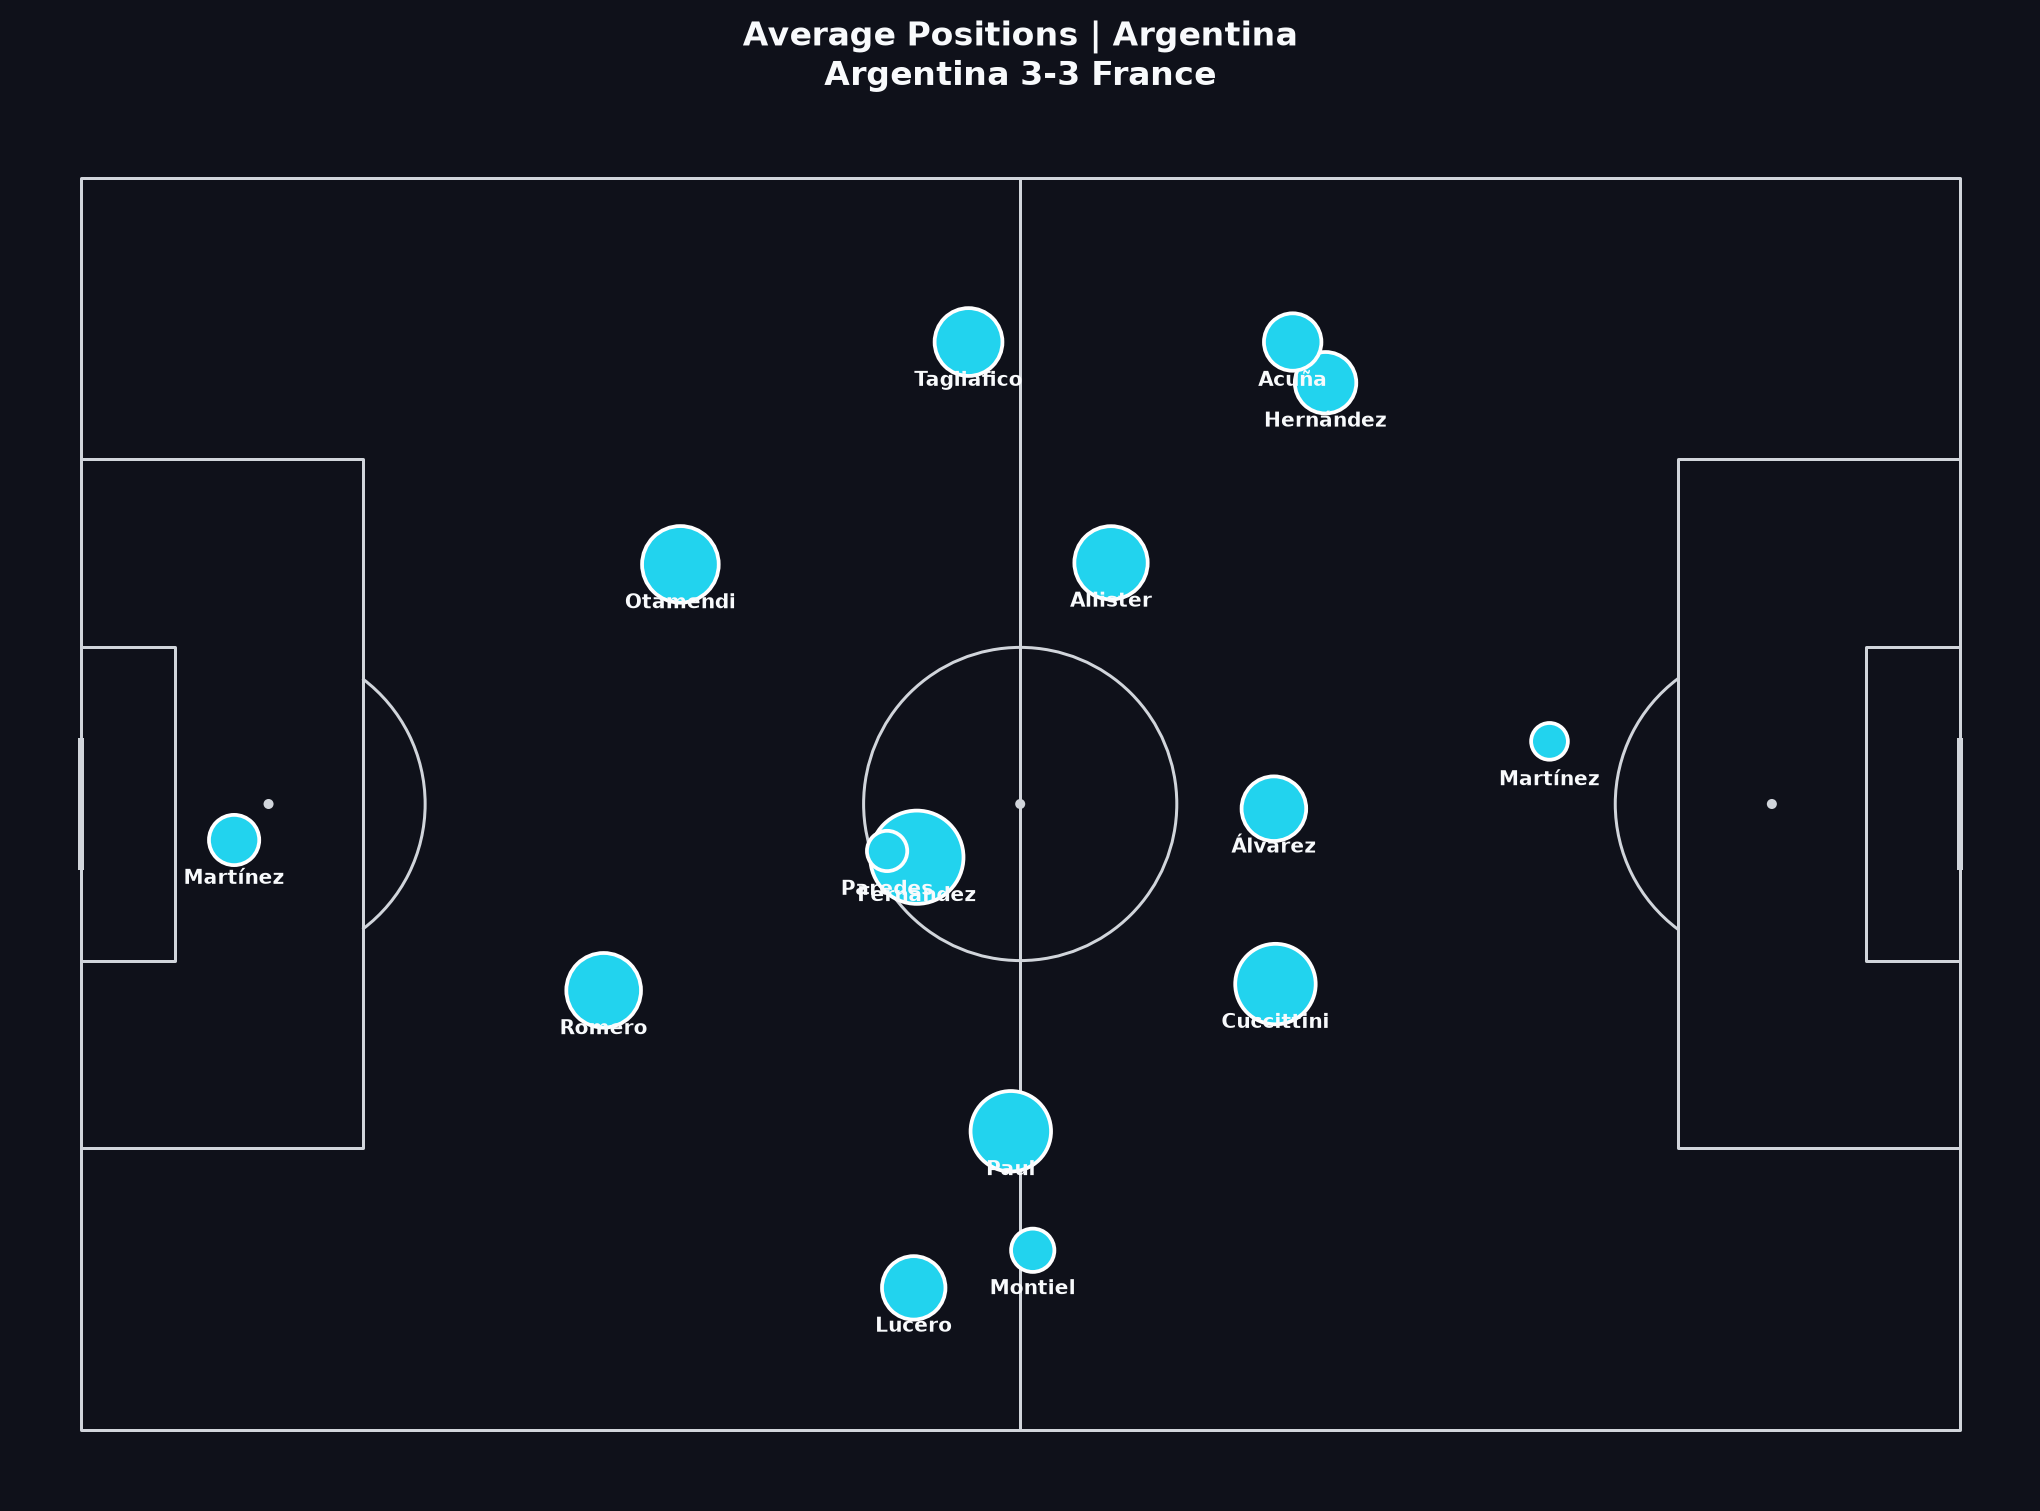
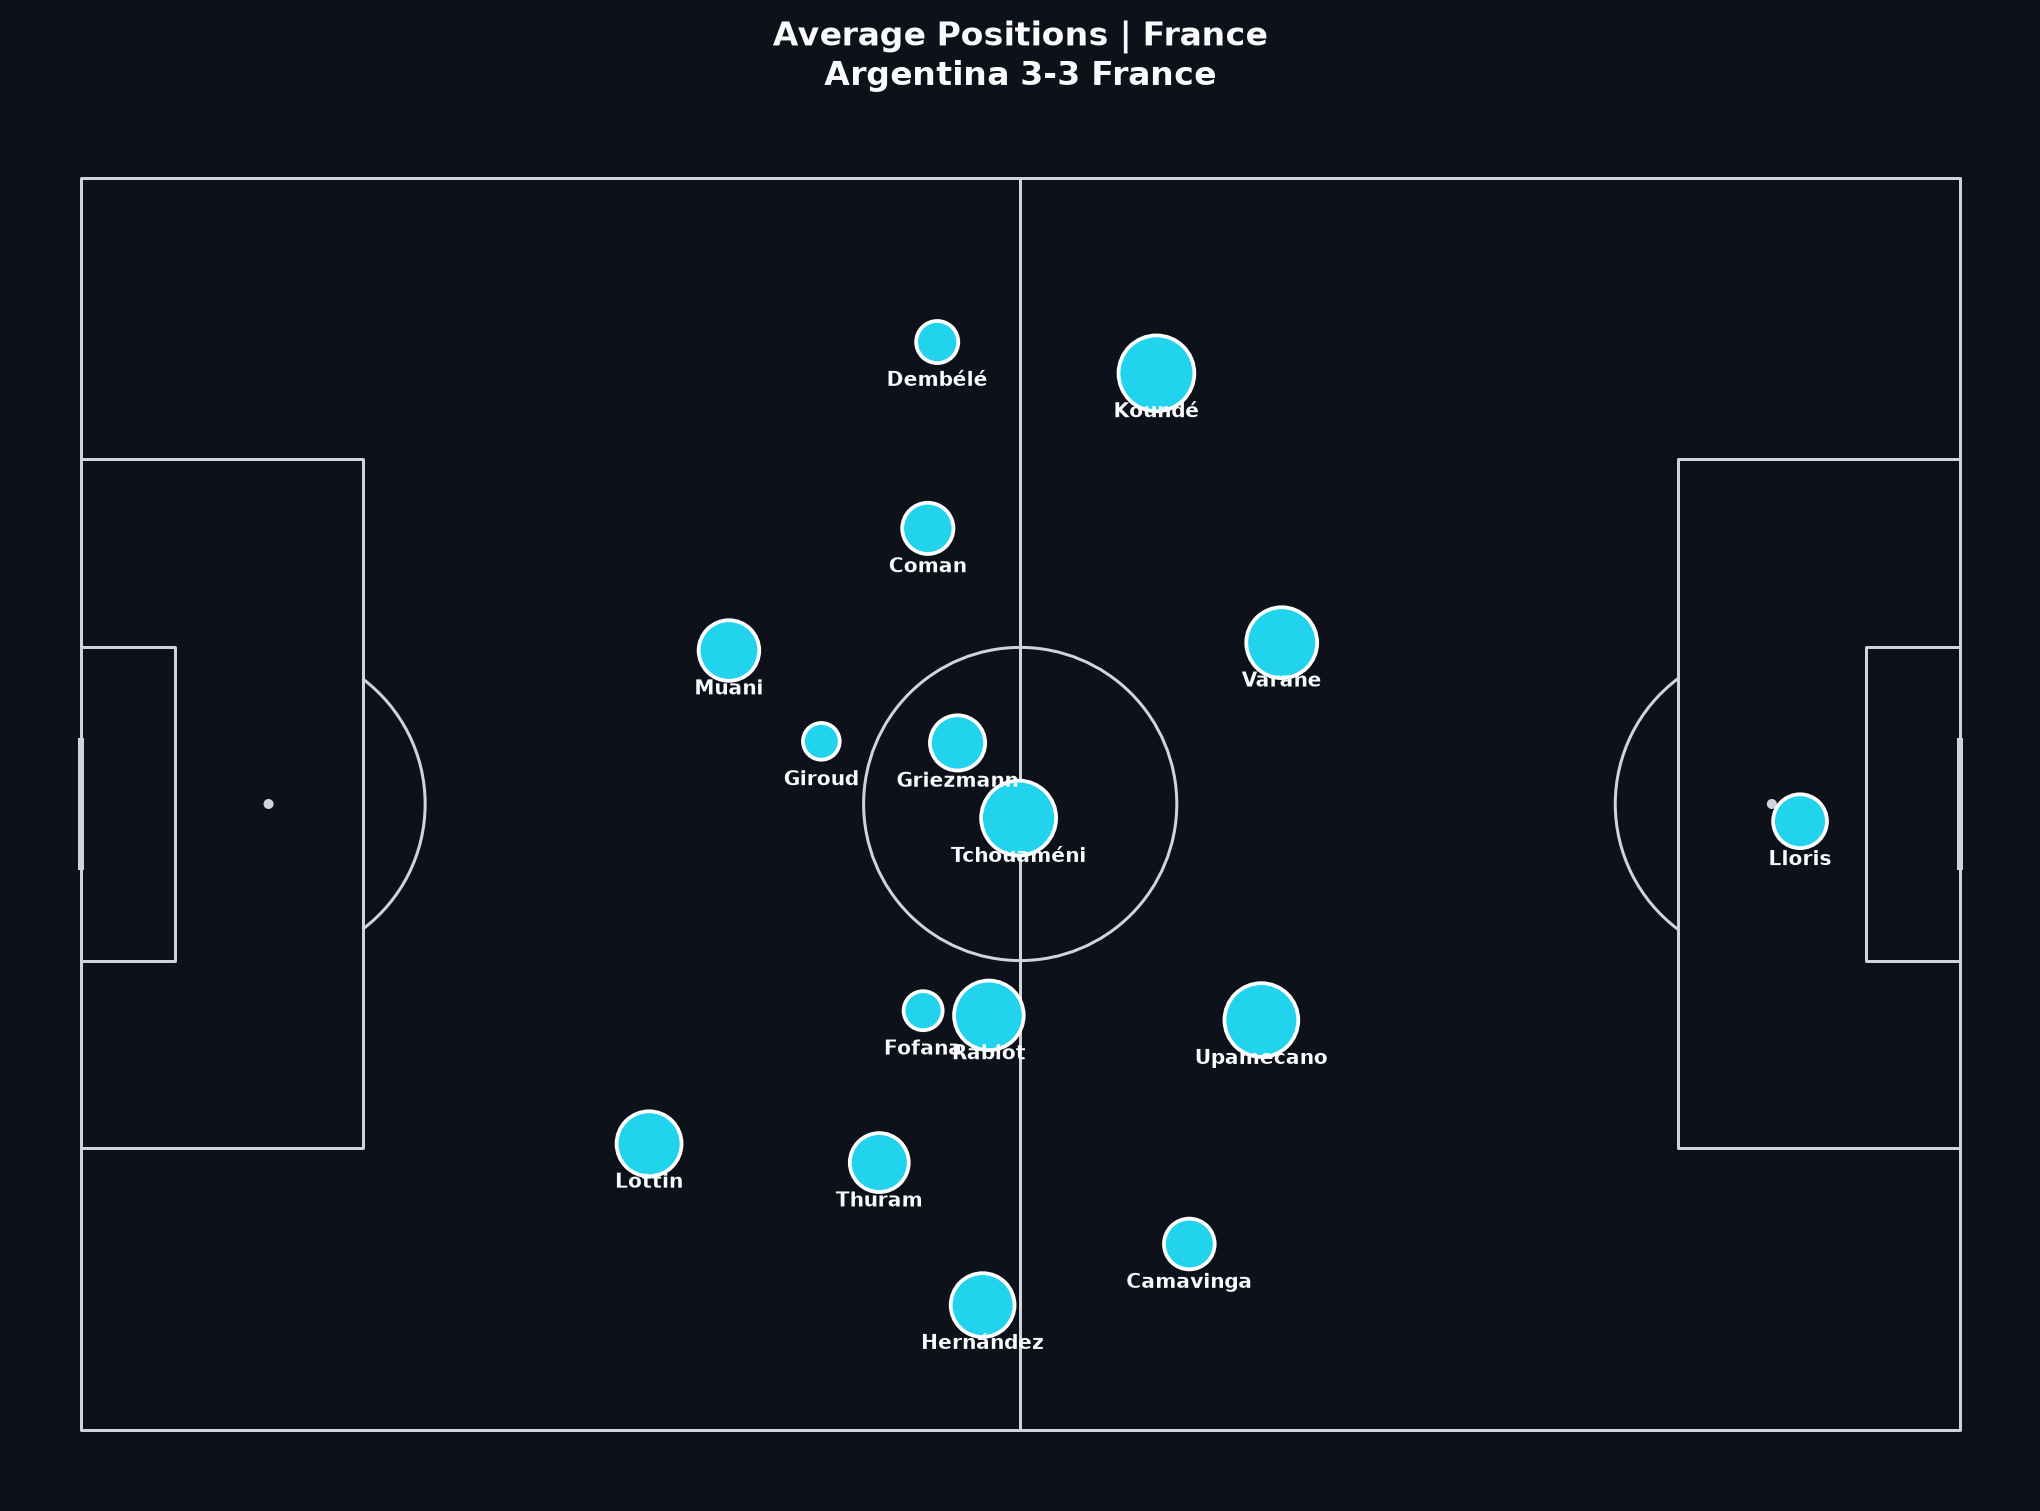
इसे कैसे पढ़ें
विस्तृत “इसे कैसे पढ़ें” बुलेट अंग्रेज़ी में हैं।
- Average position ≠ tactical role for every second. A full-back who inverts late will still leave a trail of earlier wide actions in the average.
- Use the plot to form hypotheses about height of engagement and central occupation, then test them on video clips.
- Compare the two sides’ vertical height. A higher average block can indicate territorial dominance or chasing a deficit — match state matters.
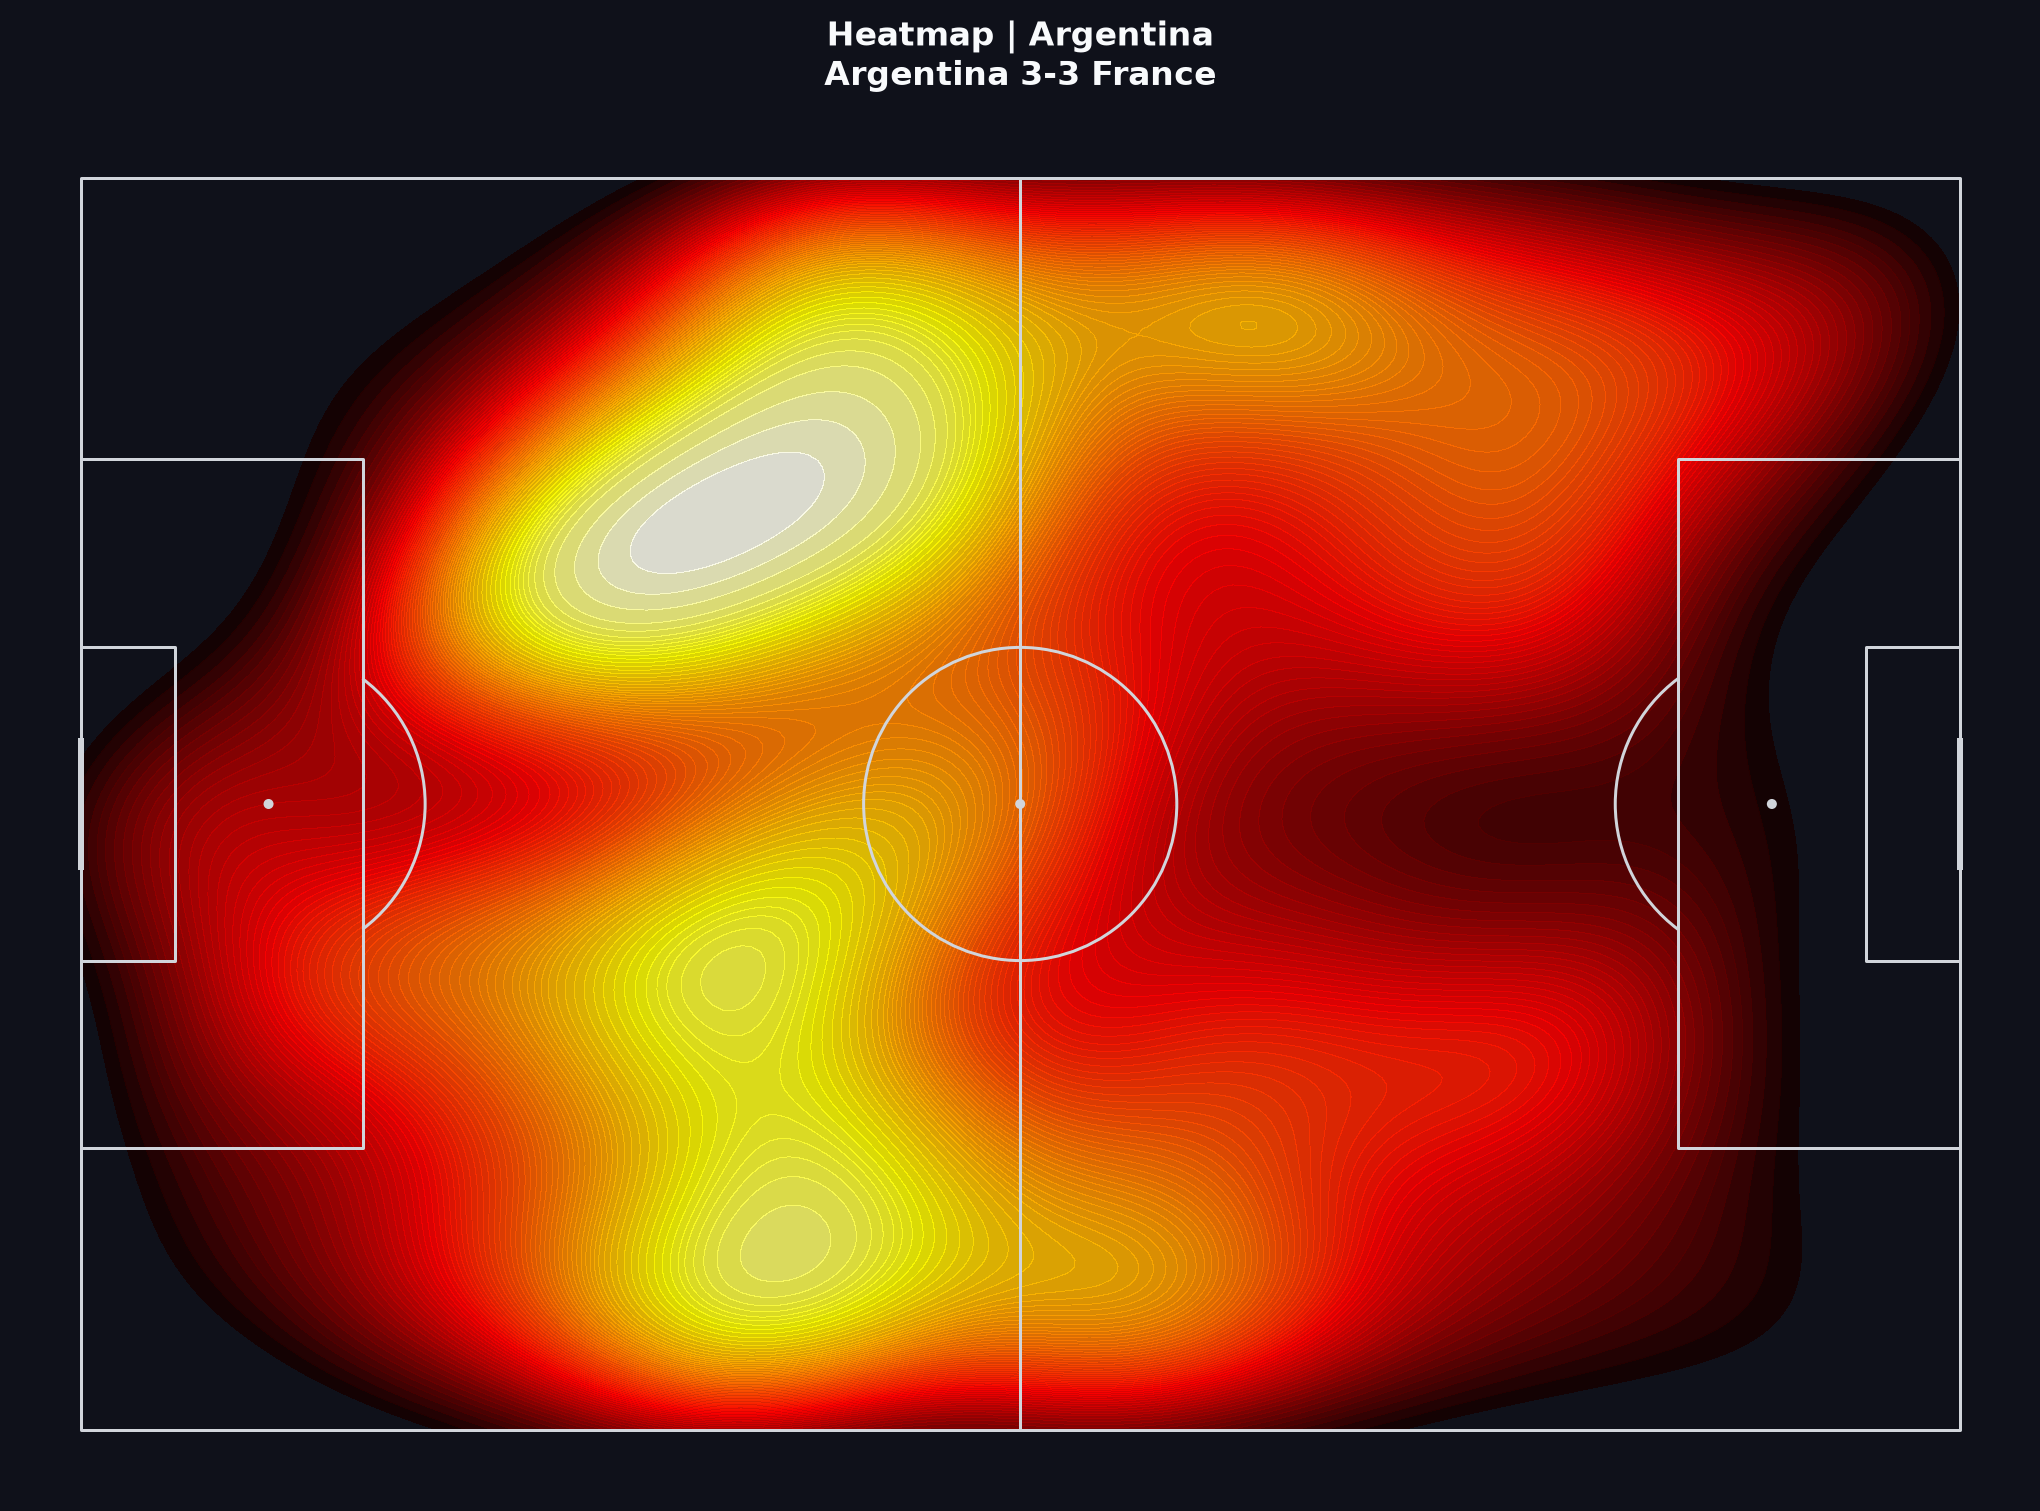
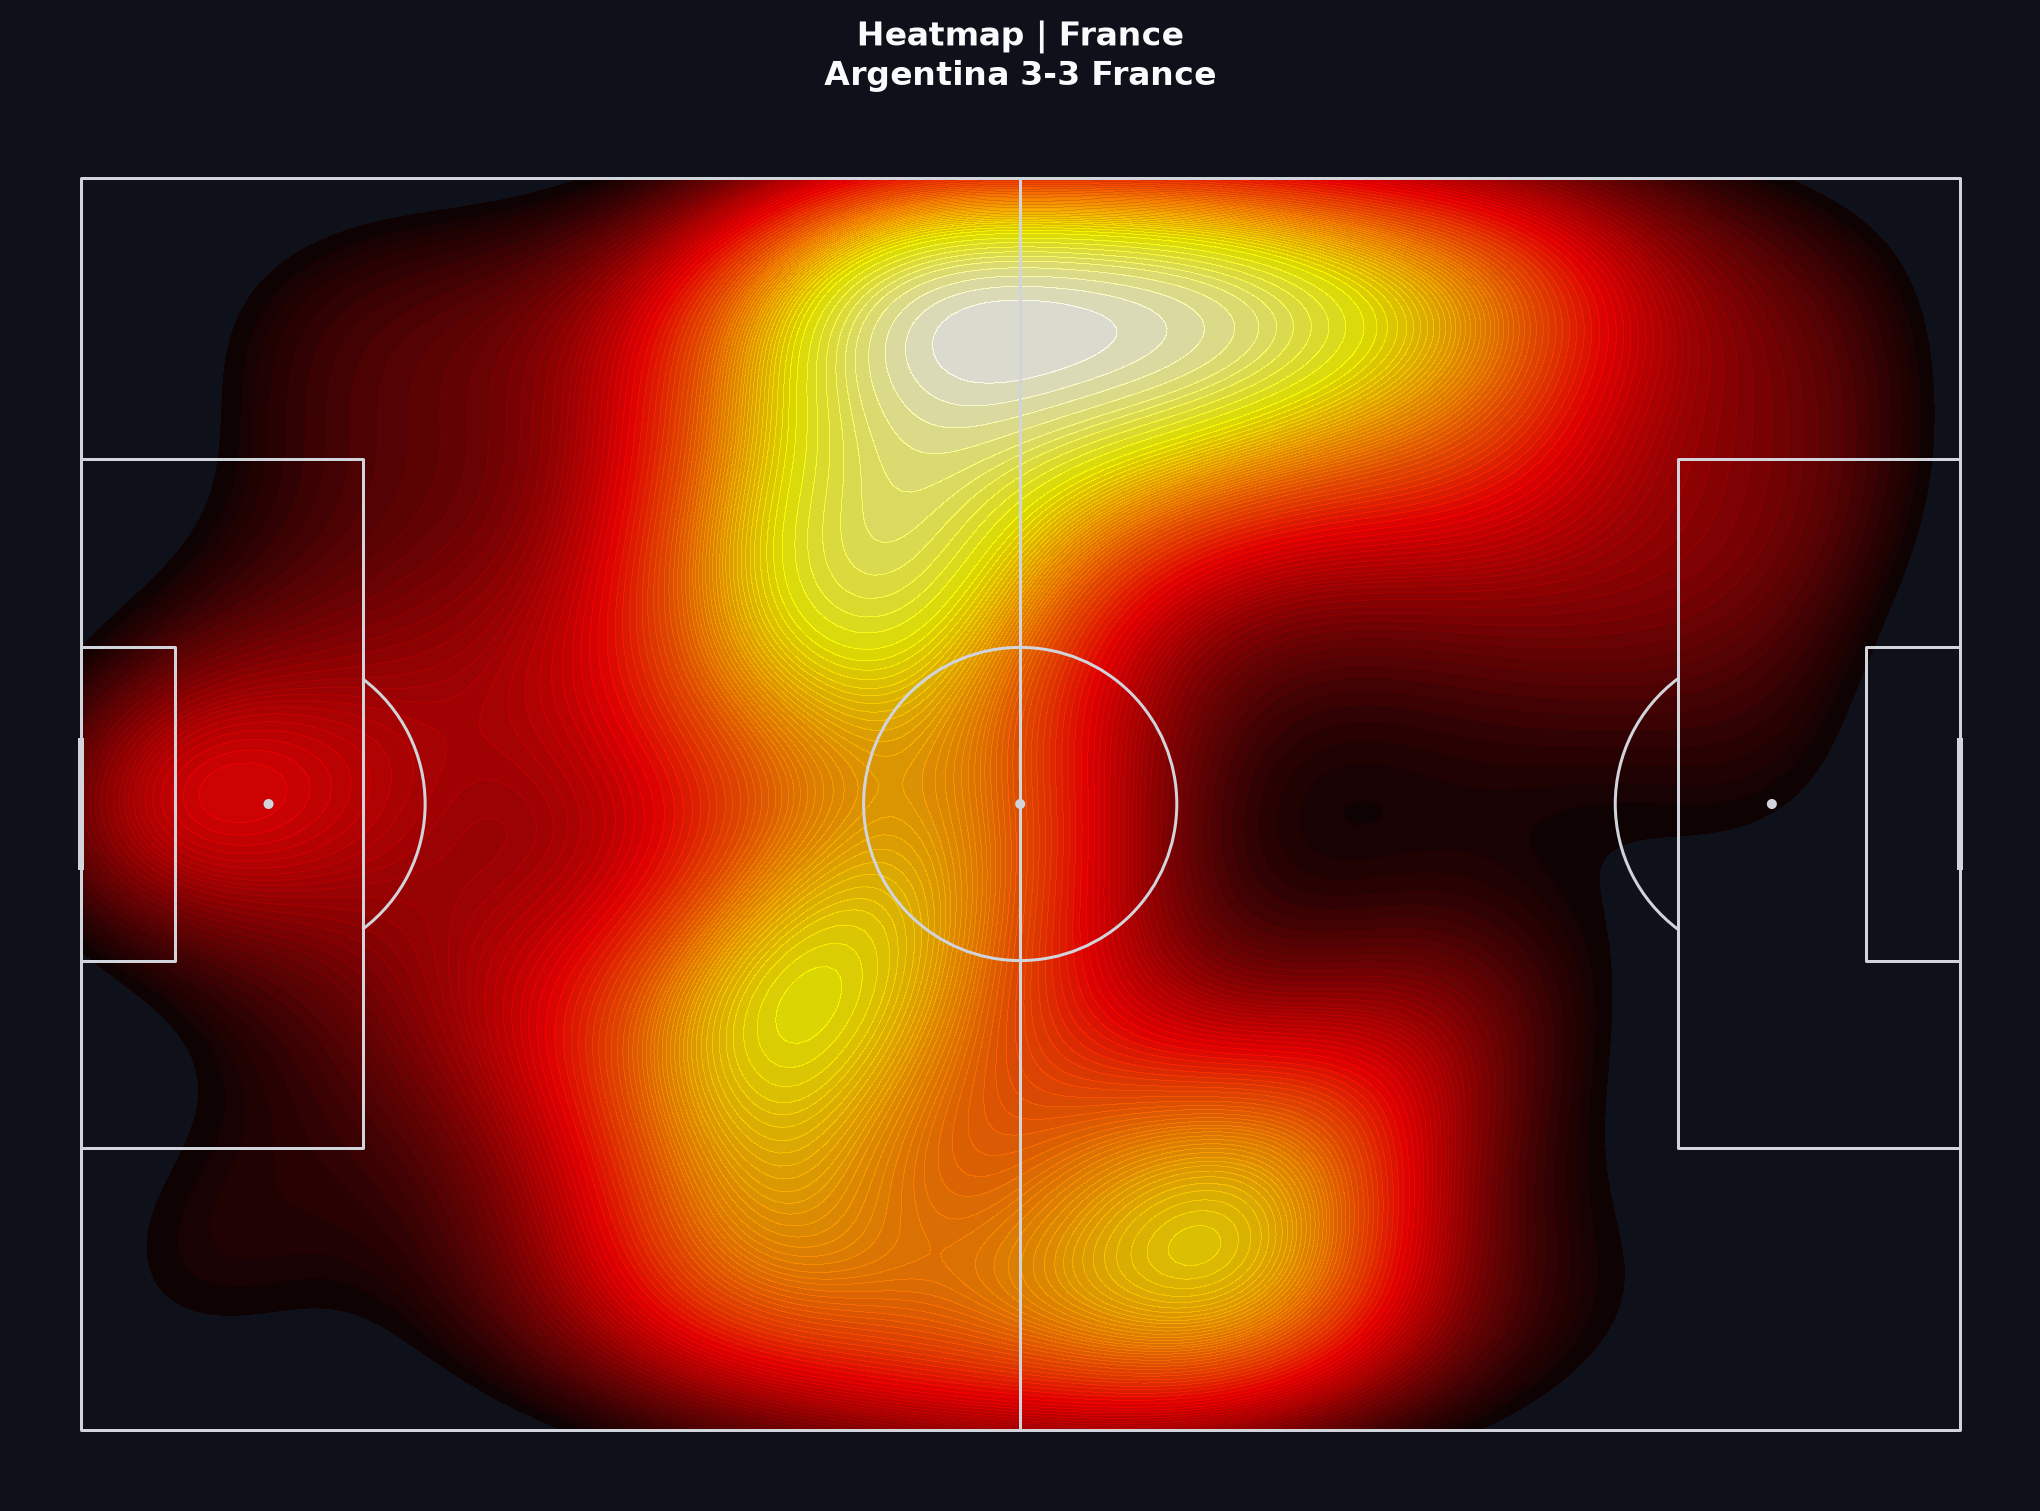
- Heatmaps (linked assets in the folder) show density of actions; average positions compress that density into one point per player. Use both ideas, not one alone.
संबंधित Learn पाठ
सभी को एक साथ रखना
समापन मार्गदर्शन सटीकता के लिए अंग्रेज़ी में रहता है।
A responsible short report on this final would state the question (for example: how Argentina controlled progression before France’s late surge), show evidence by layer (network → progressive passes → shots), and keep the shoot-out analytically separate.
If you are following the Learn path, write five sentences using only claims these visuals can support — then note what still requires video.
अभ्यास प्रॉम्प्ट
150–200 शब्दों में: (1) अर्जेंटीना के बिल्ड-अप के बारे में एक दावा, (2) फ्रांस के मौके की गुणवत्ता या समय के बारे में एक दावा, (3) इस मैच में इवेंट डेटा की एक सीमा। प्रत्येक दावे को ऊपर दिए दृश्य से जोड़ें।
Event data from StatsBomb’s public World Cup 2022 release. Coordinates use StatsBomb’s pitch model.