
Laboratório de Partidas / Copa do Mundo FIFA 2022
Oitavas de final · 2022-12-06
Marrocos 0–0 Espanha
Após o prolongamento · Marrocos venceu nos pênaltis
Education City Stadium · StatsBomb Open Data
Títulos e resumos estão localizados. Guias detalhados de leitura abaixo permanecem em inglês para precisão.
Por que esta partida é útil para aprender
- It is one of the clearest open-data examples of possession volume without a matching open-play goal tally — perfect for teaching sterile control versus territorial threat.
- Spain’s pass network and progressive-pass map show sustained build-up; Morocco’s maps show a compact block with selective progression. Comparing the two prevents equating ‘more passes’ with ‘better football’.
- Shot volume and xG stay modest for both sides in periods 1–4. That forces careful reading: domination of the ball is not the same as domination of chance quality.
- The penalty shoot-out sits in period 5. Mixing shoot-out shots into open-play process totals is a common mistake this fixture helps expose.
Contexto da partida
Spain controlled large stretches of possession across regulation and extra time. Morocco stayed organised, limited high-quality chances, and won the shoot-out after a 0–0 draw.
For teaching, treat periods 1–4 as the match process. Period 5 (penalties) is a different exercise under special rules — keep it out of open-play xG and progressive summaries.
Periods 1–4 (90 minutes + extra time)
Figures below exclude the penalty shoot-out (period 5) so process reading is not distorted by shoot-out attempts.
- Marrocos
- 6 remates · 0 golos · ~0.57 xG
- Passes progressivos: 77 (30.8% de passes)
- Espanha
- 12 remates · 0 golos · ~0.49 xG
- Passes progressivos: 162 (16.9% de passes)
Visual 1
Mapa de remates
Neither side converted in open play. Read clusters for chance quality and location — not as a verdict that Spain ‘deserved’ a win from possession alone.
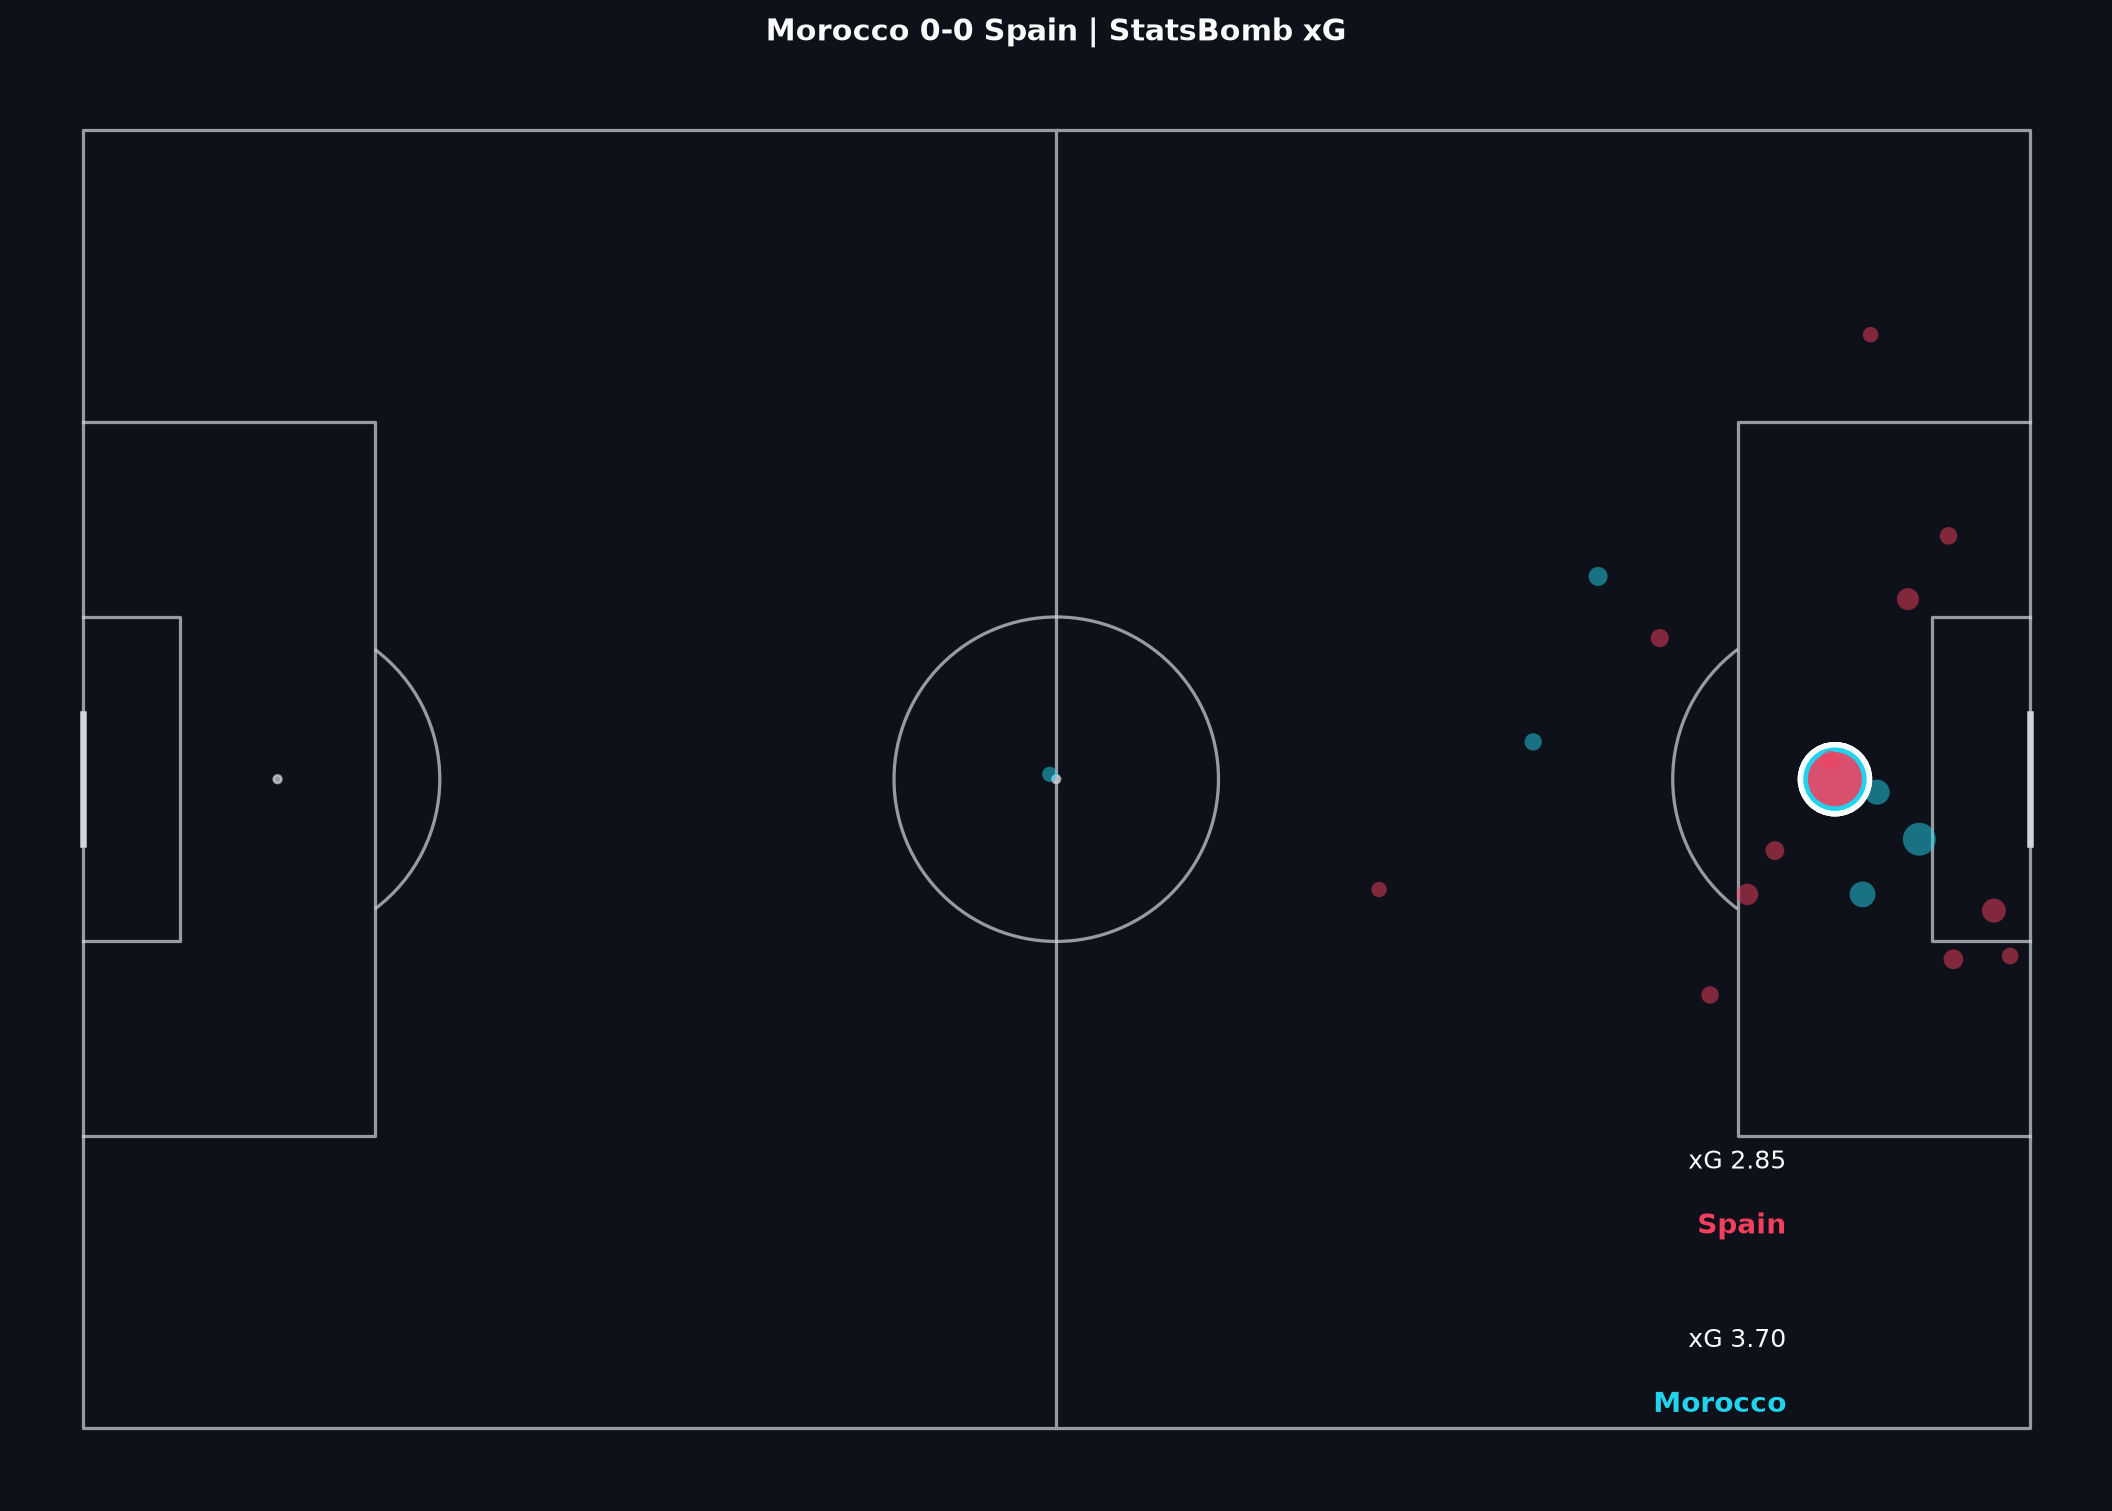
Como ler isto
Detalhes de “Como ler” estão em inglês.
- Start with location and quality, not pass counts. A team can dominate circulation and still create few box chances.
- Compare Spain’s higher shot volume with Morocco’s fewer attempts. Similar open-play xG totals here are a reminder that volume and quality are different questions.
- Ask which attempts came from sustained pressure versus transitions or set pieces. A deep block often concedes territory while still protecting the box.
- Keep shoot-out attempts out of this story. The map for teaching this fixture is the open-play process in periods 1–4.
Lições relacionadas do Aprender
Visual 2
Rede de passes
Spain’s network is dense and multi-node; Morocco’s is lighter and more selective. Density measures combination frequency — not moral superiority.
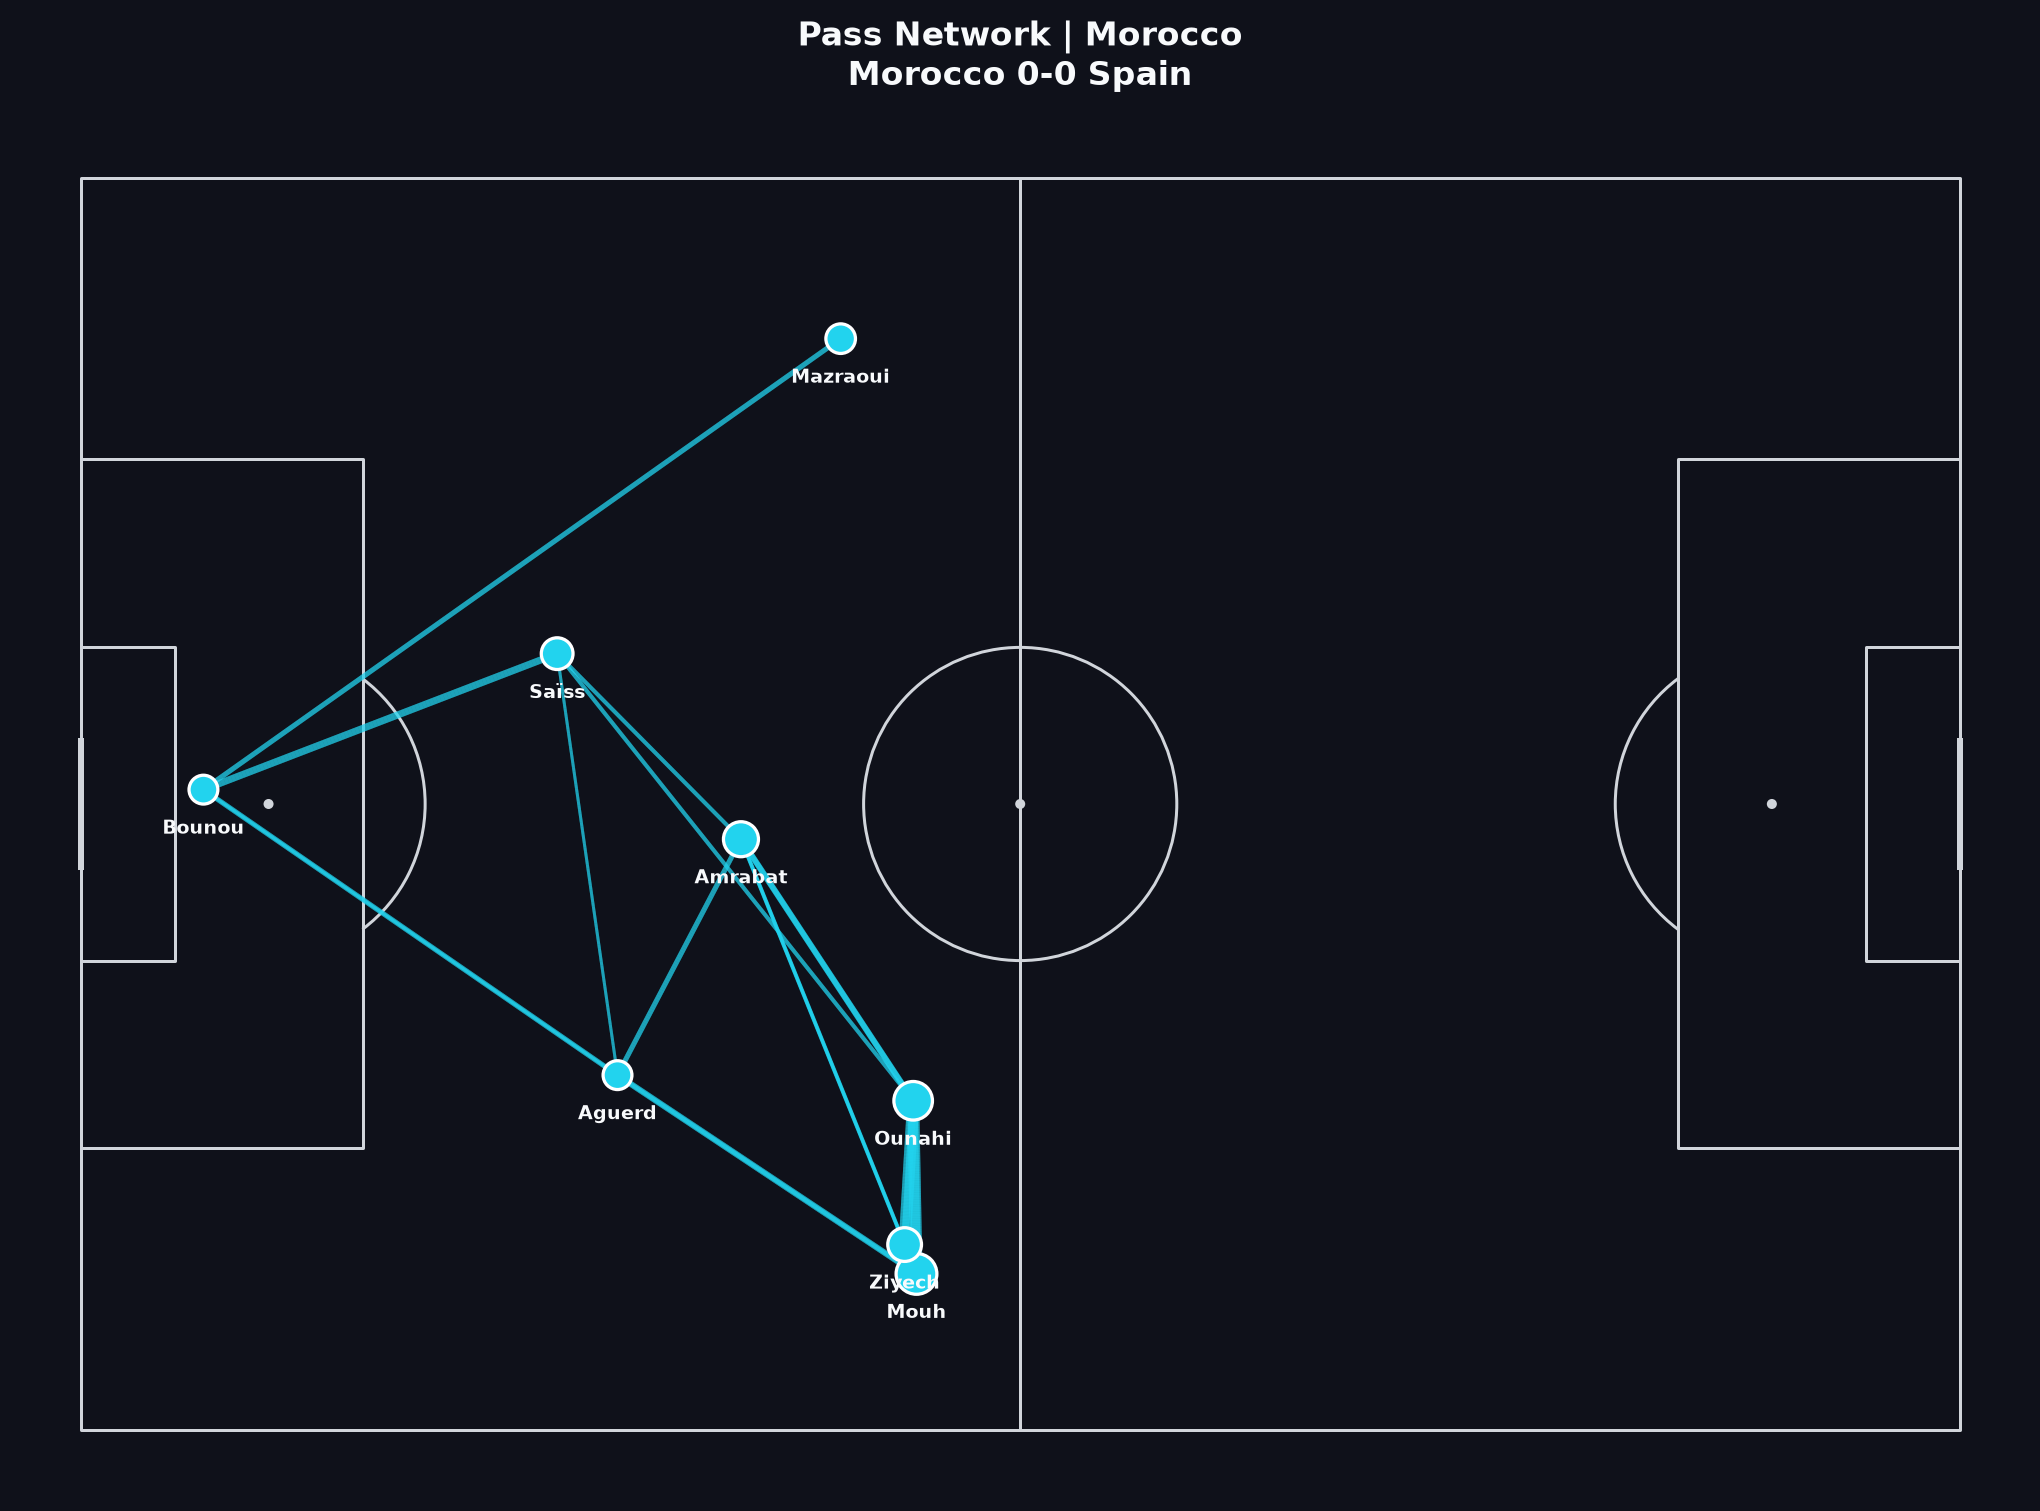
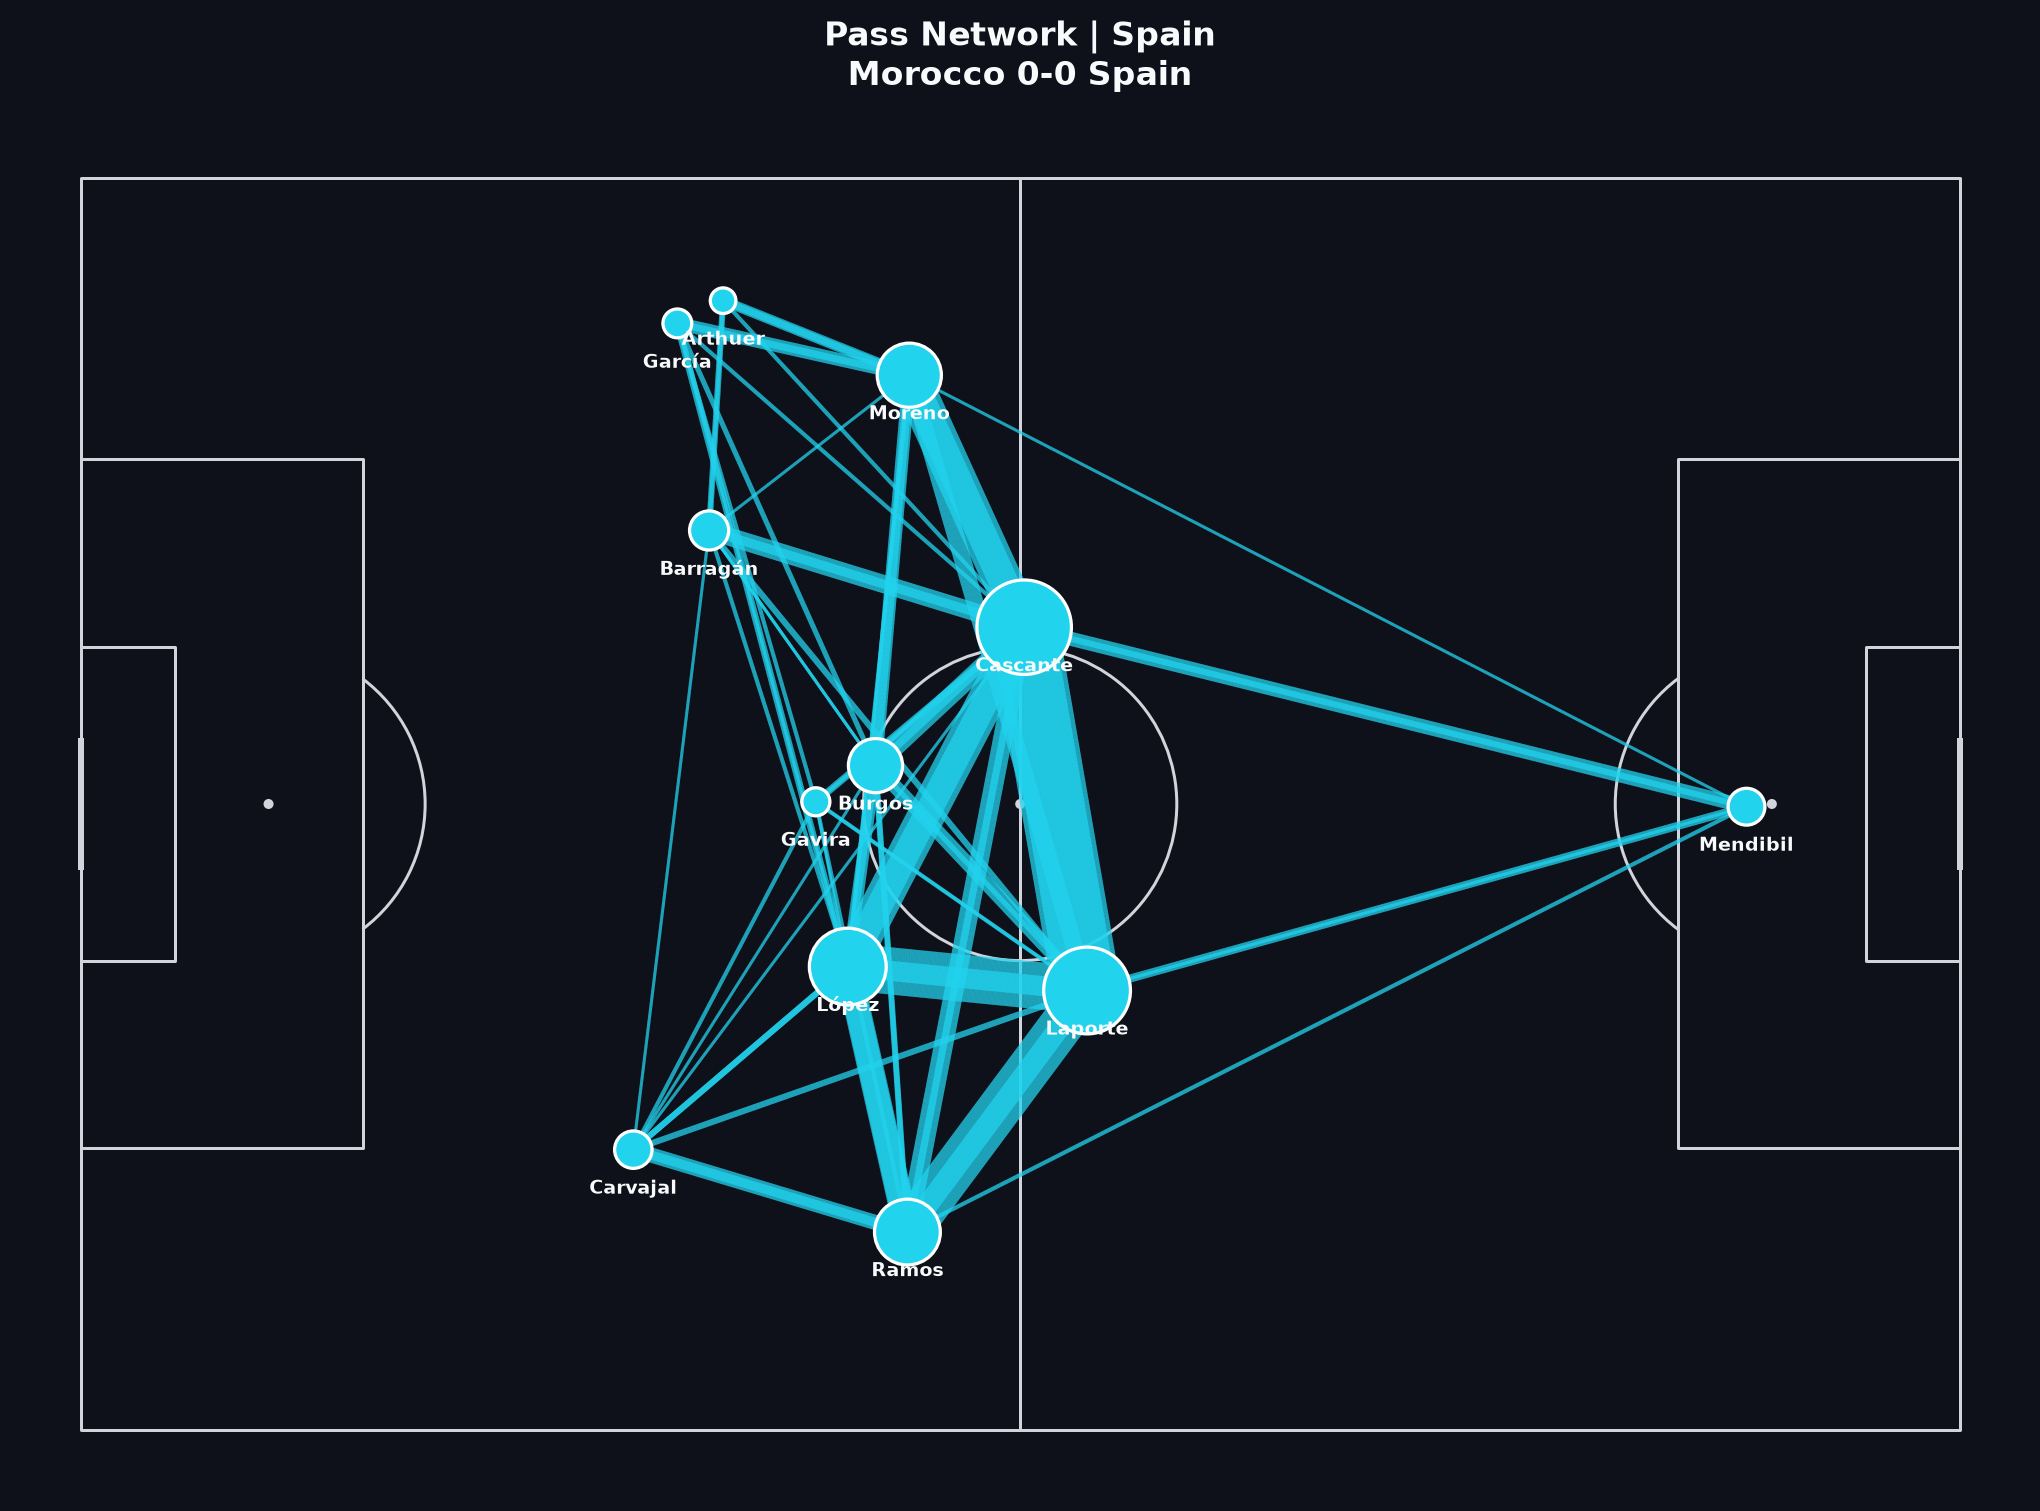
Como ler isto
Detalhes de “Como ler” estão em inglês.
- Look for hubs in Spain’s first and second lines. Heavy circulation behind a compact block is expected when the opponent refuses to open central lanes.
- Morocco’s thinner network can still be successful if connections protect rest-defence and enable rare progressive exits.
- Do not treat a denser graph as proof of a better plan. Confirm overload hypotheses with video before naming intent.
- Extra time and substitutions flatten phases into one average picture — useful for structure, weak for minute-by-minute narrative.
Lições relacionadas do Aprender
Visual 3
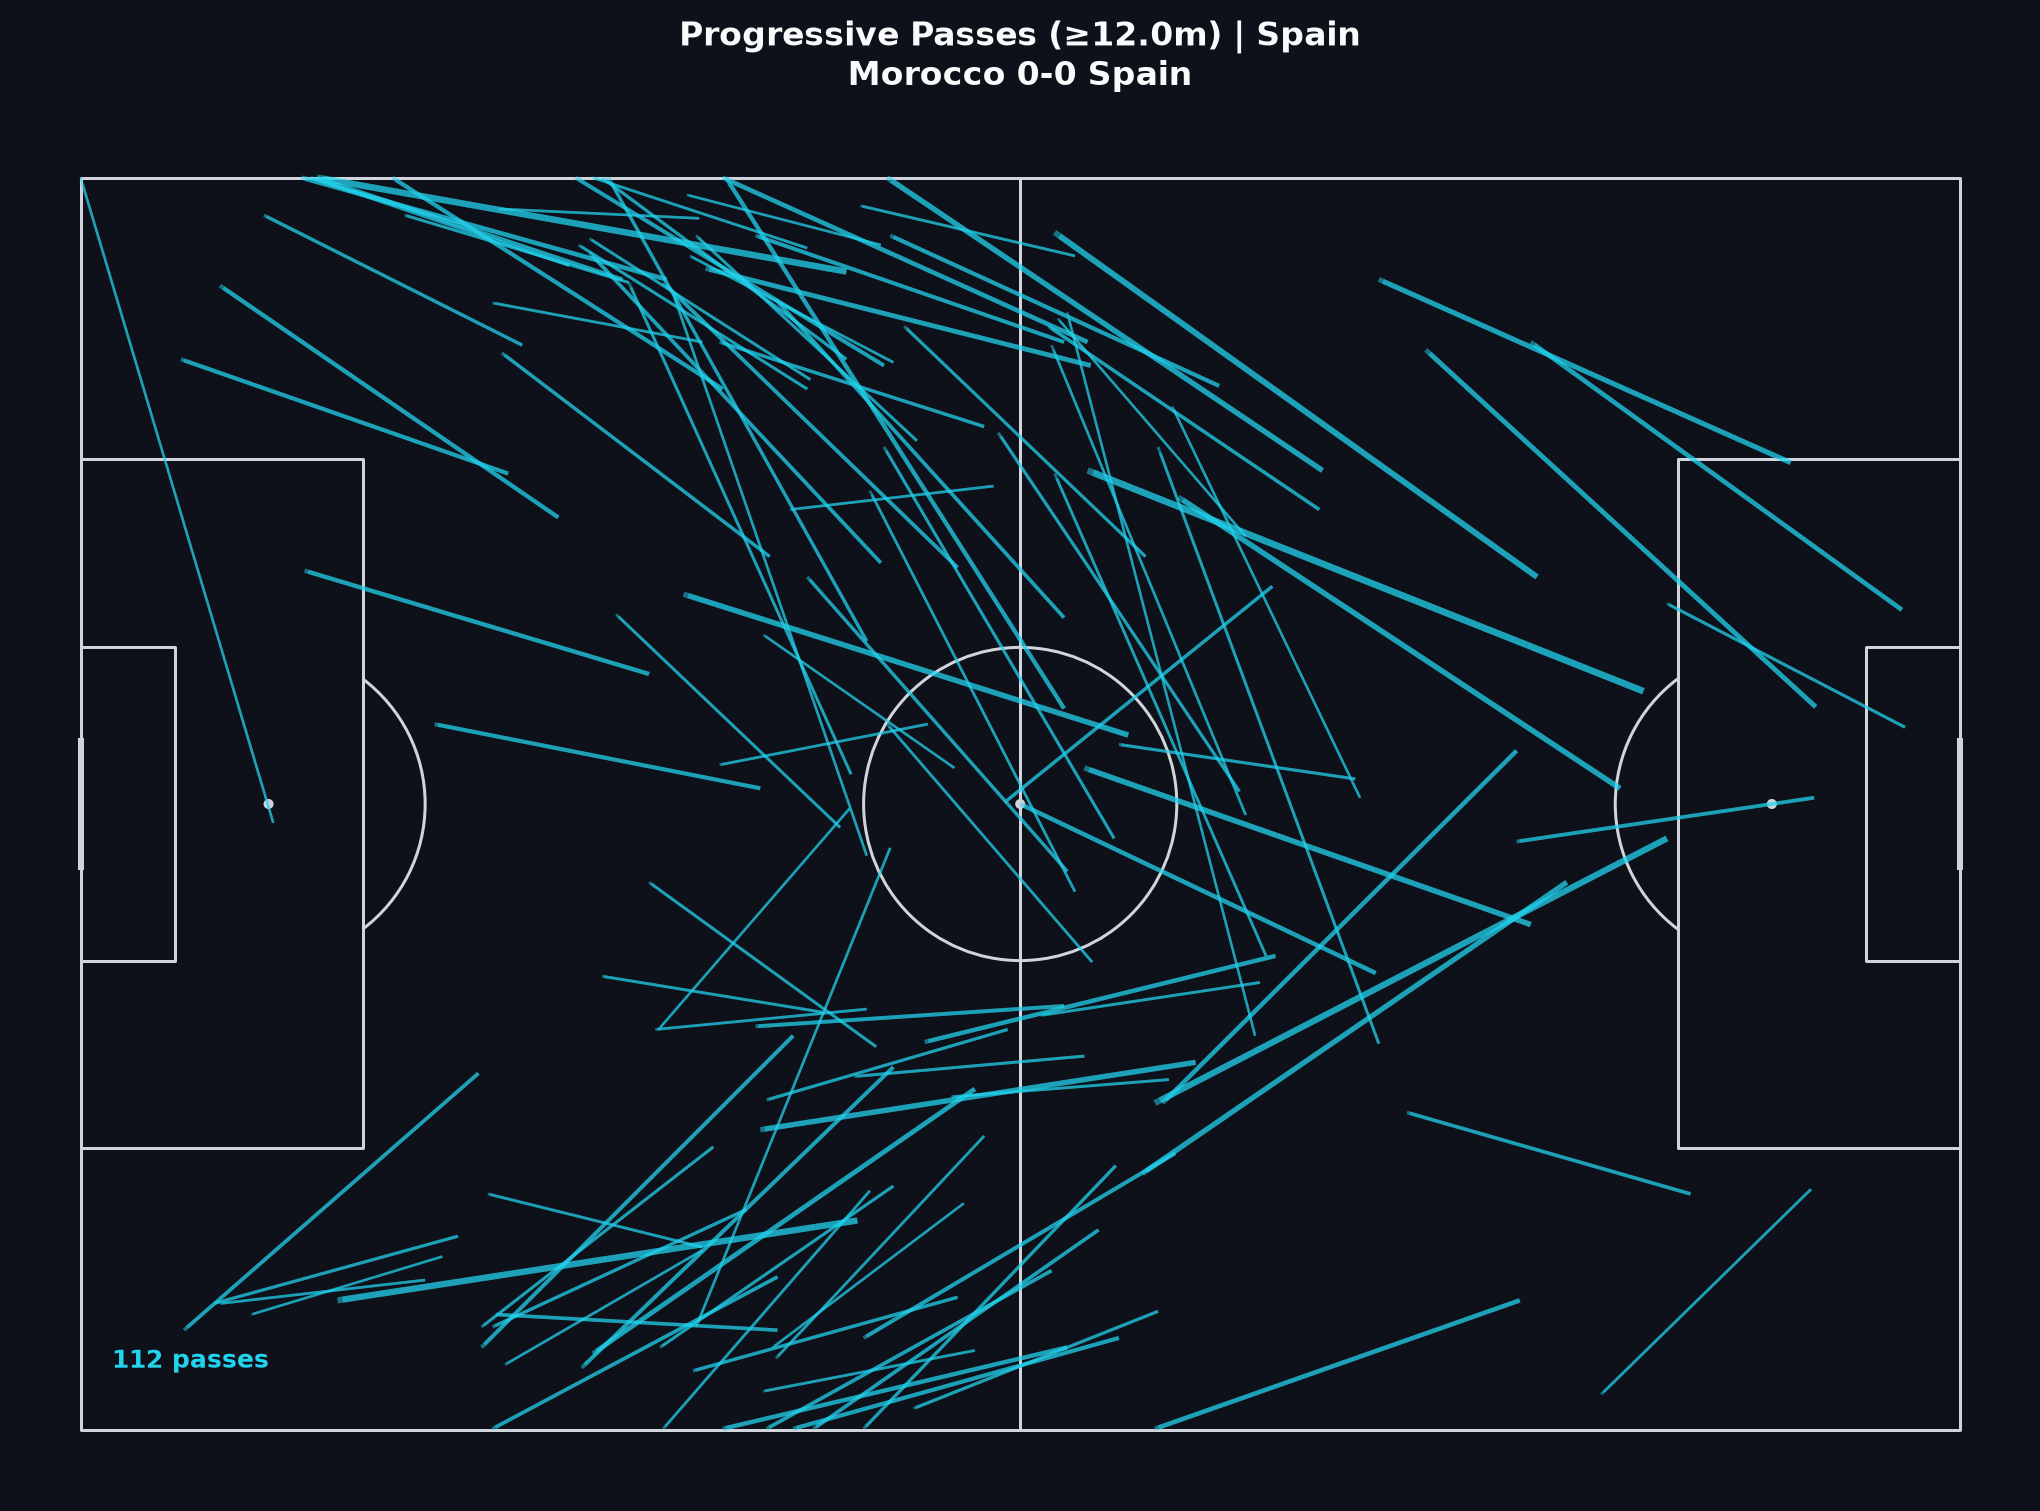
Passes progressivos
Spain records far more progressive passes in absolute terms (~162 vs ~77) because they complete far more passes overall. Morocco’s progressive share of completed passes is higher (~31% vs ~17%) — a classic deep-block versus possession contrast.
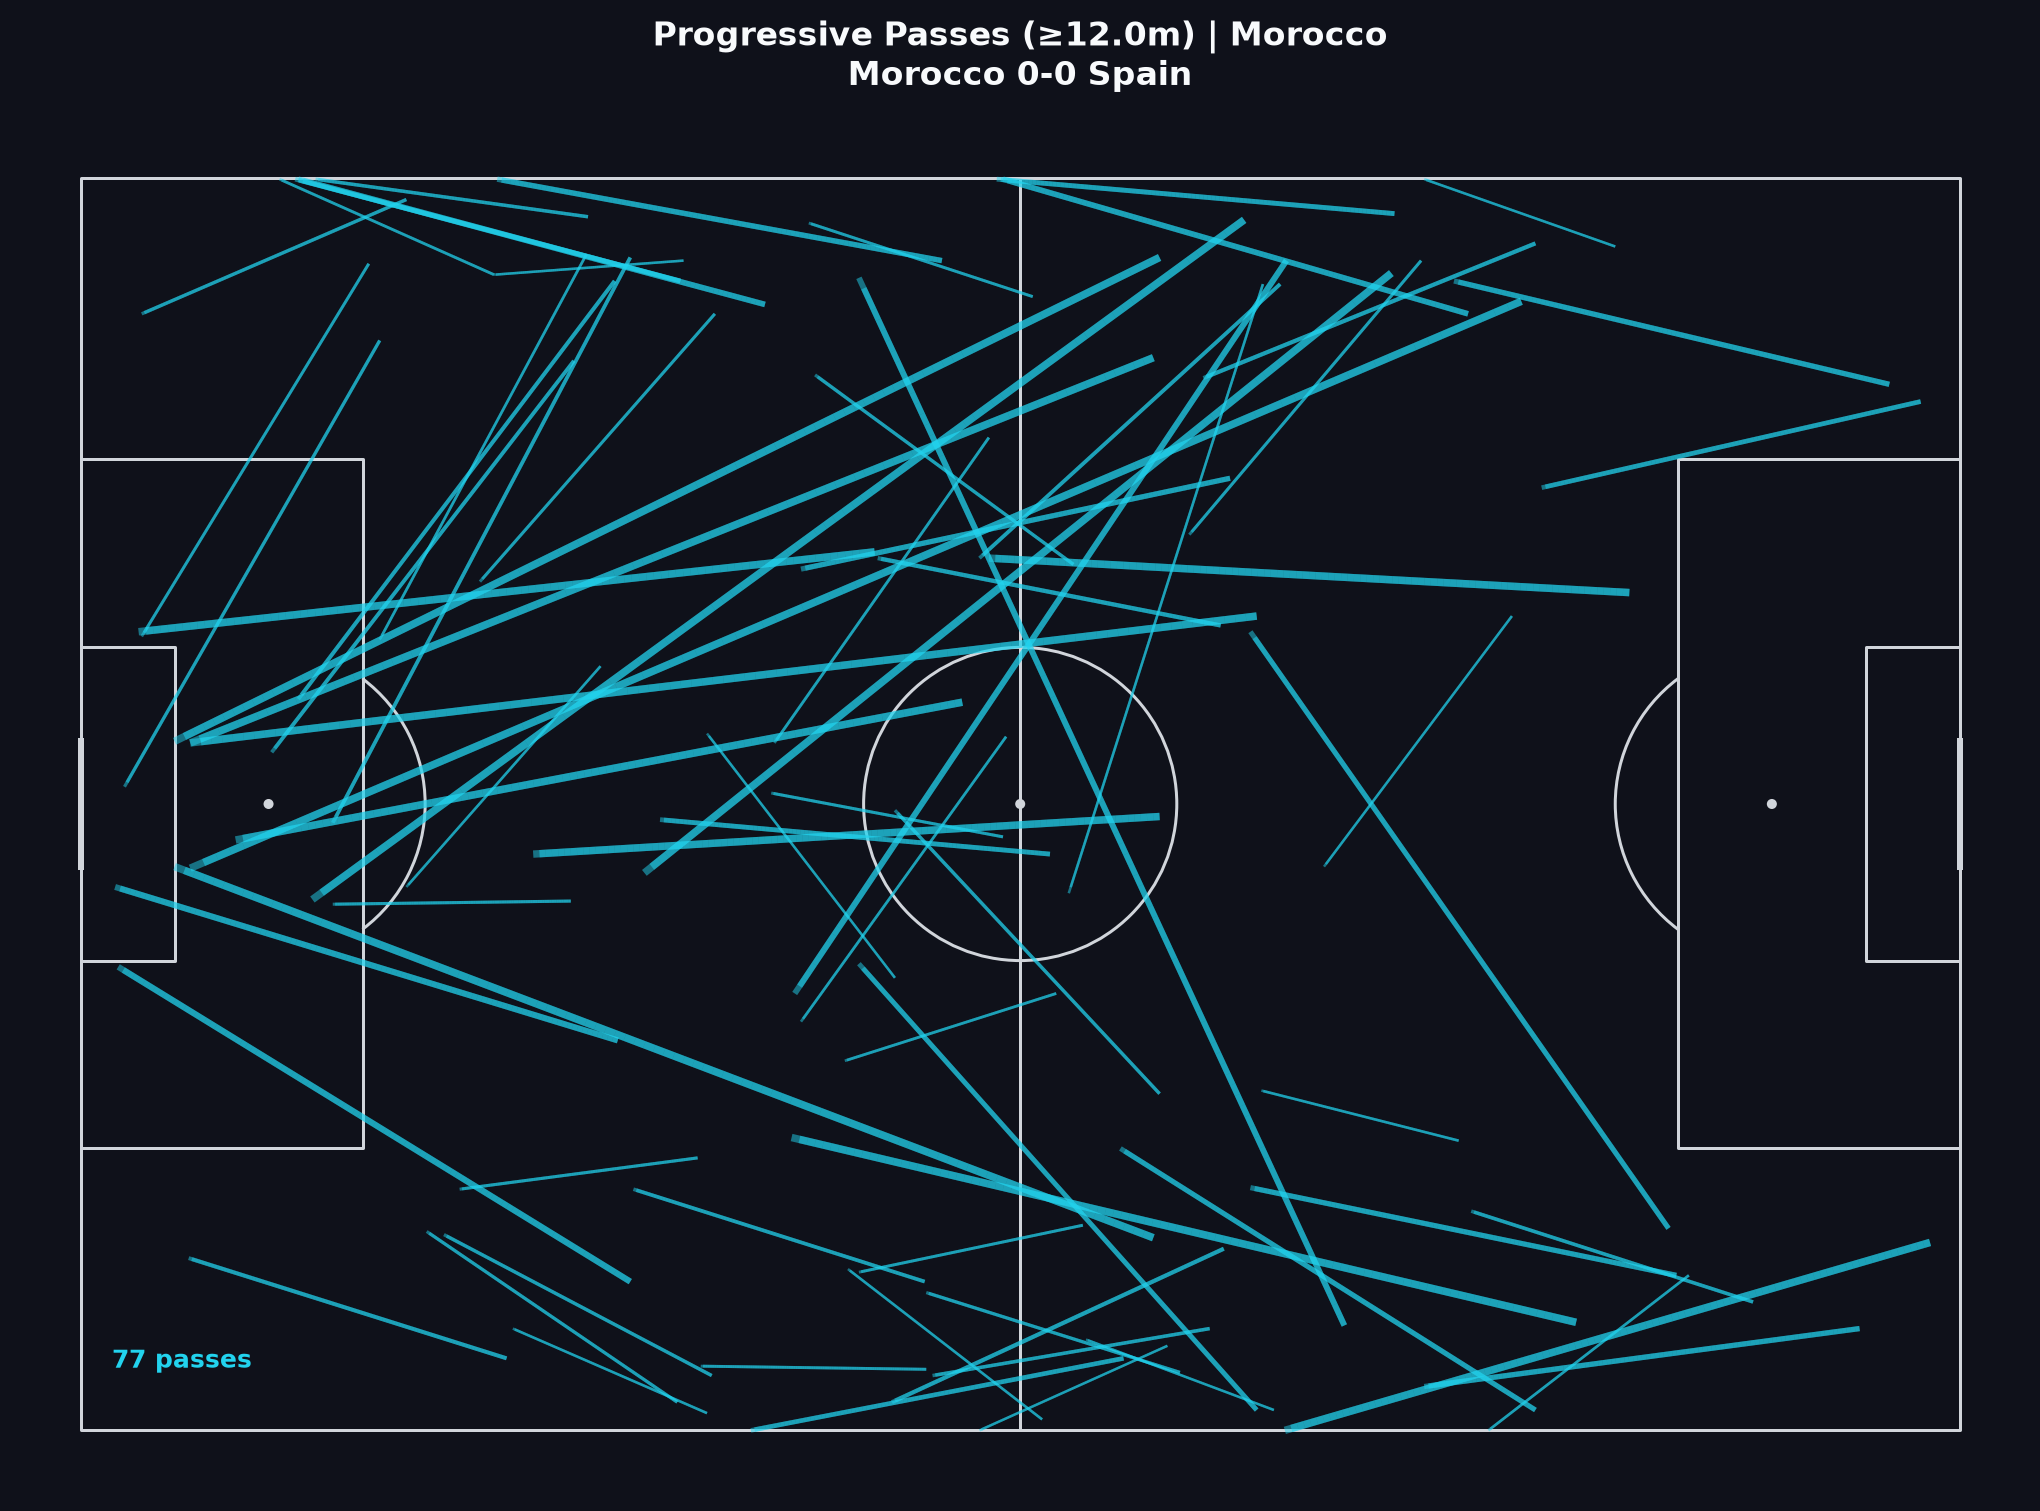
Como ler isto
Detalhes de “Como ler” estão em inglês.
- Separate absolute progressive volume from progressive share. Spain’s volume reflects control of the ball; Morocco’s share reflects how often their completed passes advanced territory when they had it.
- Trace end zones. Progression that dies outside the box is different from progression that feeds shot locations.
- Pair this map with the shot map: high progressive volume without goals is not a contradiction if chance quality stays modest.
- Ask whether Spain’s progression was into useful spaces or recycled in front of a set block — video decides that question.
Lições relacionadas do Aprender
Visual 4
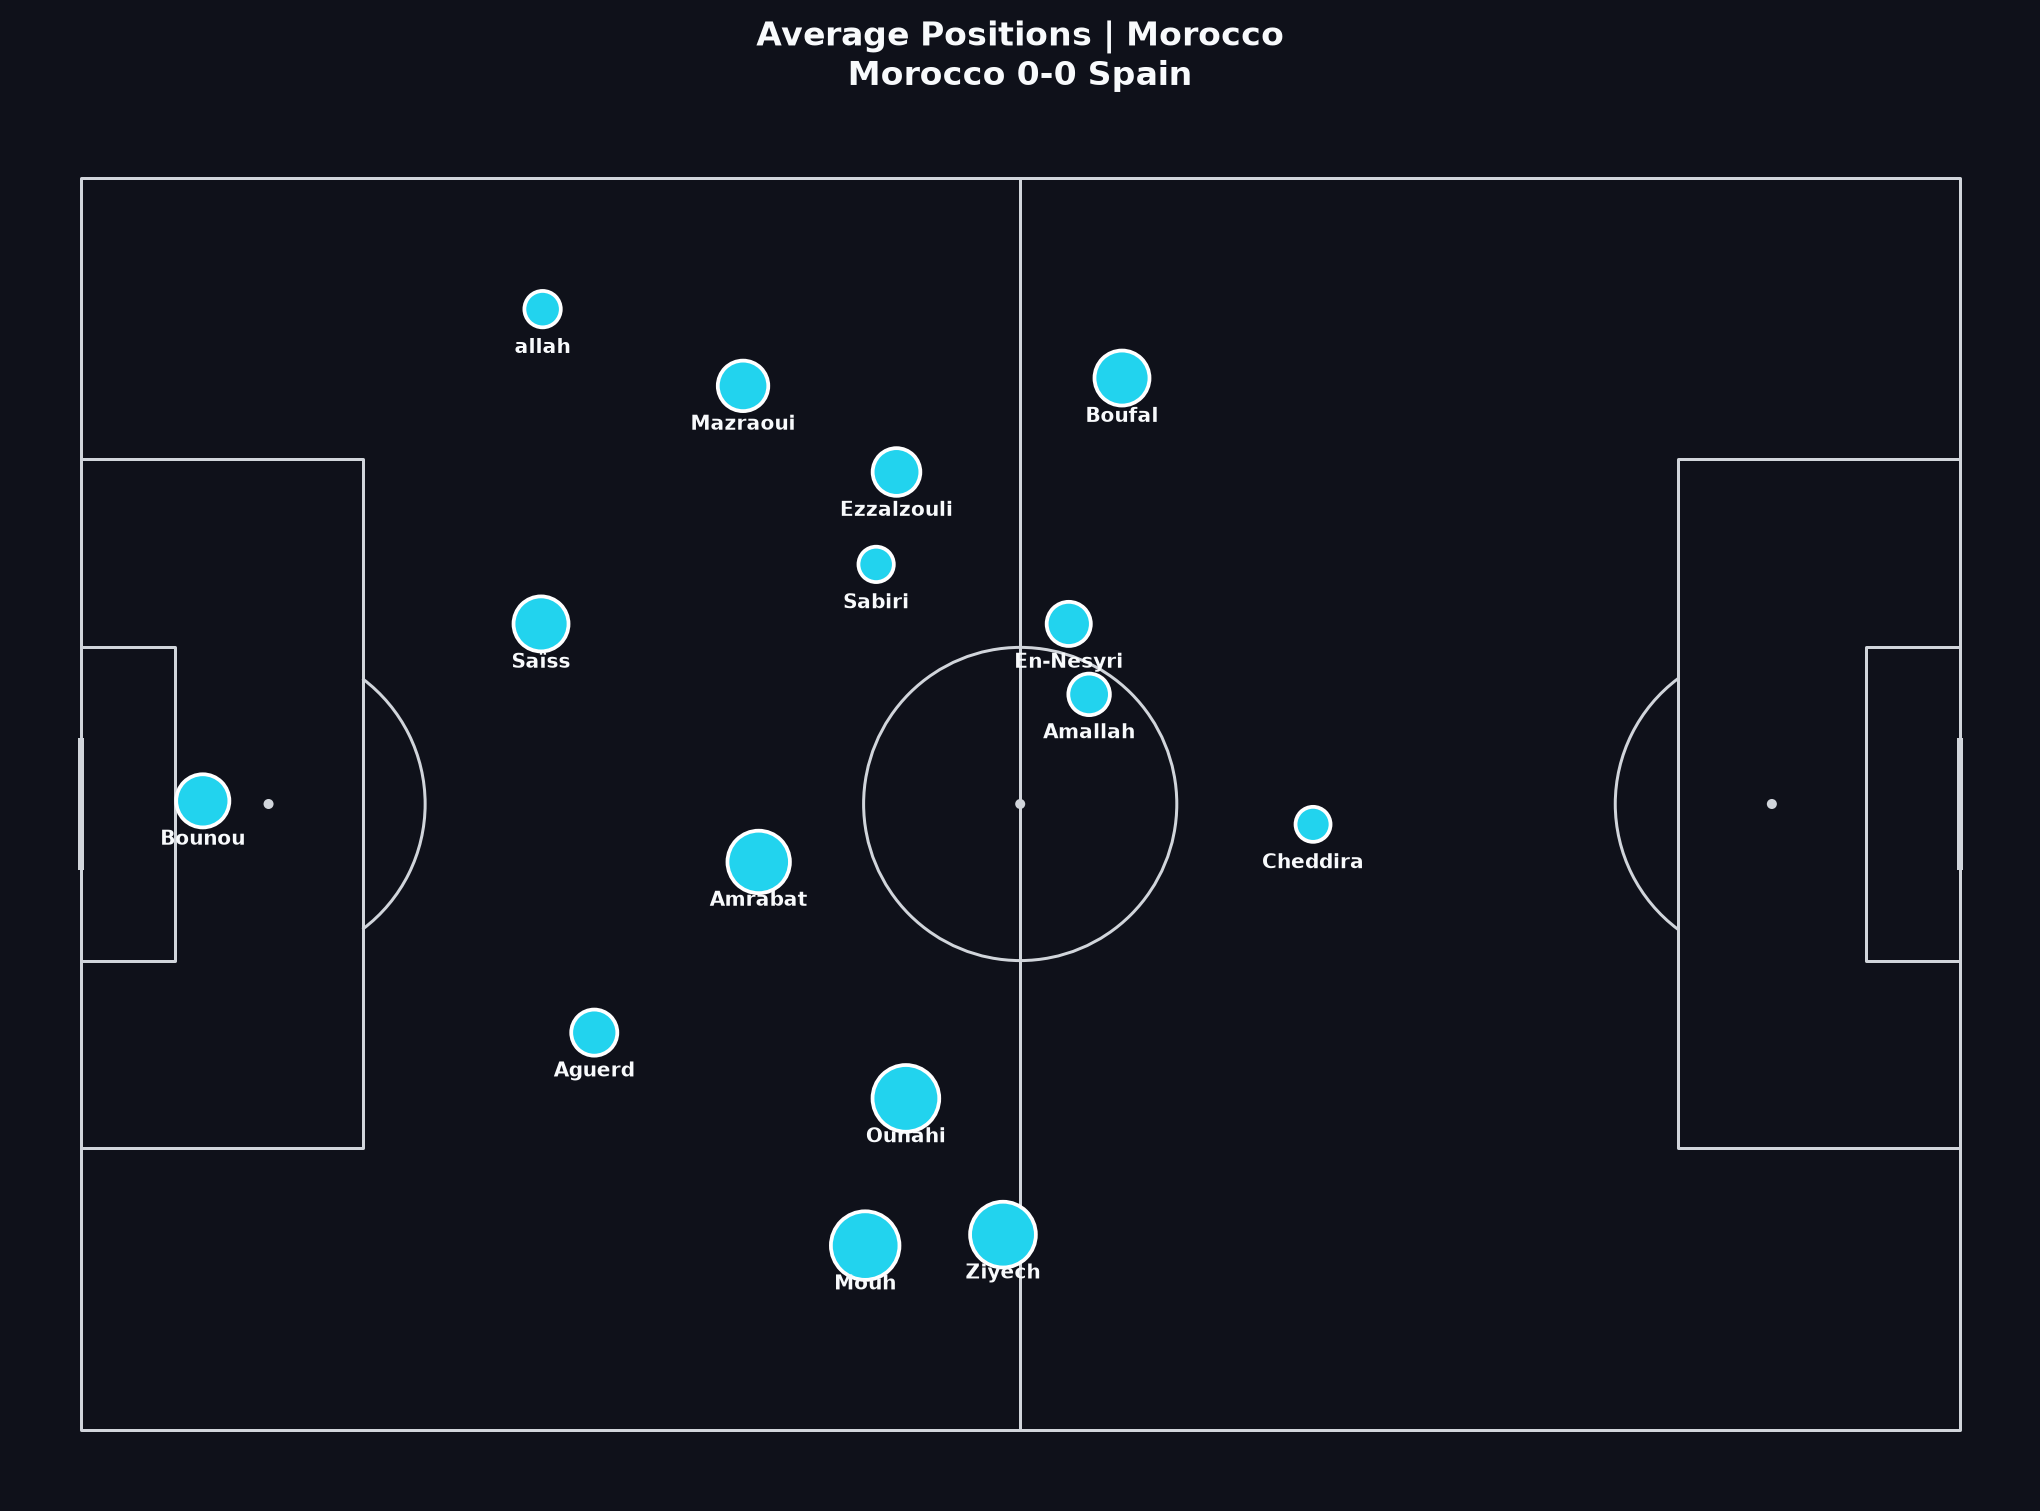
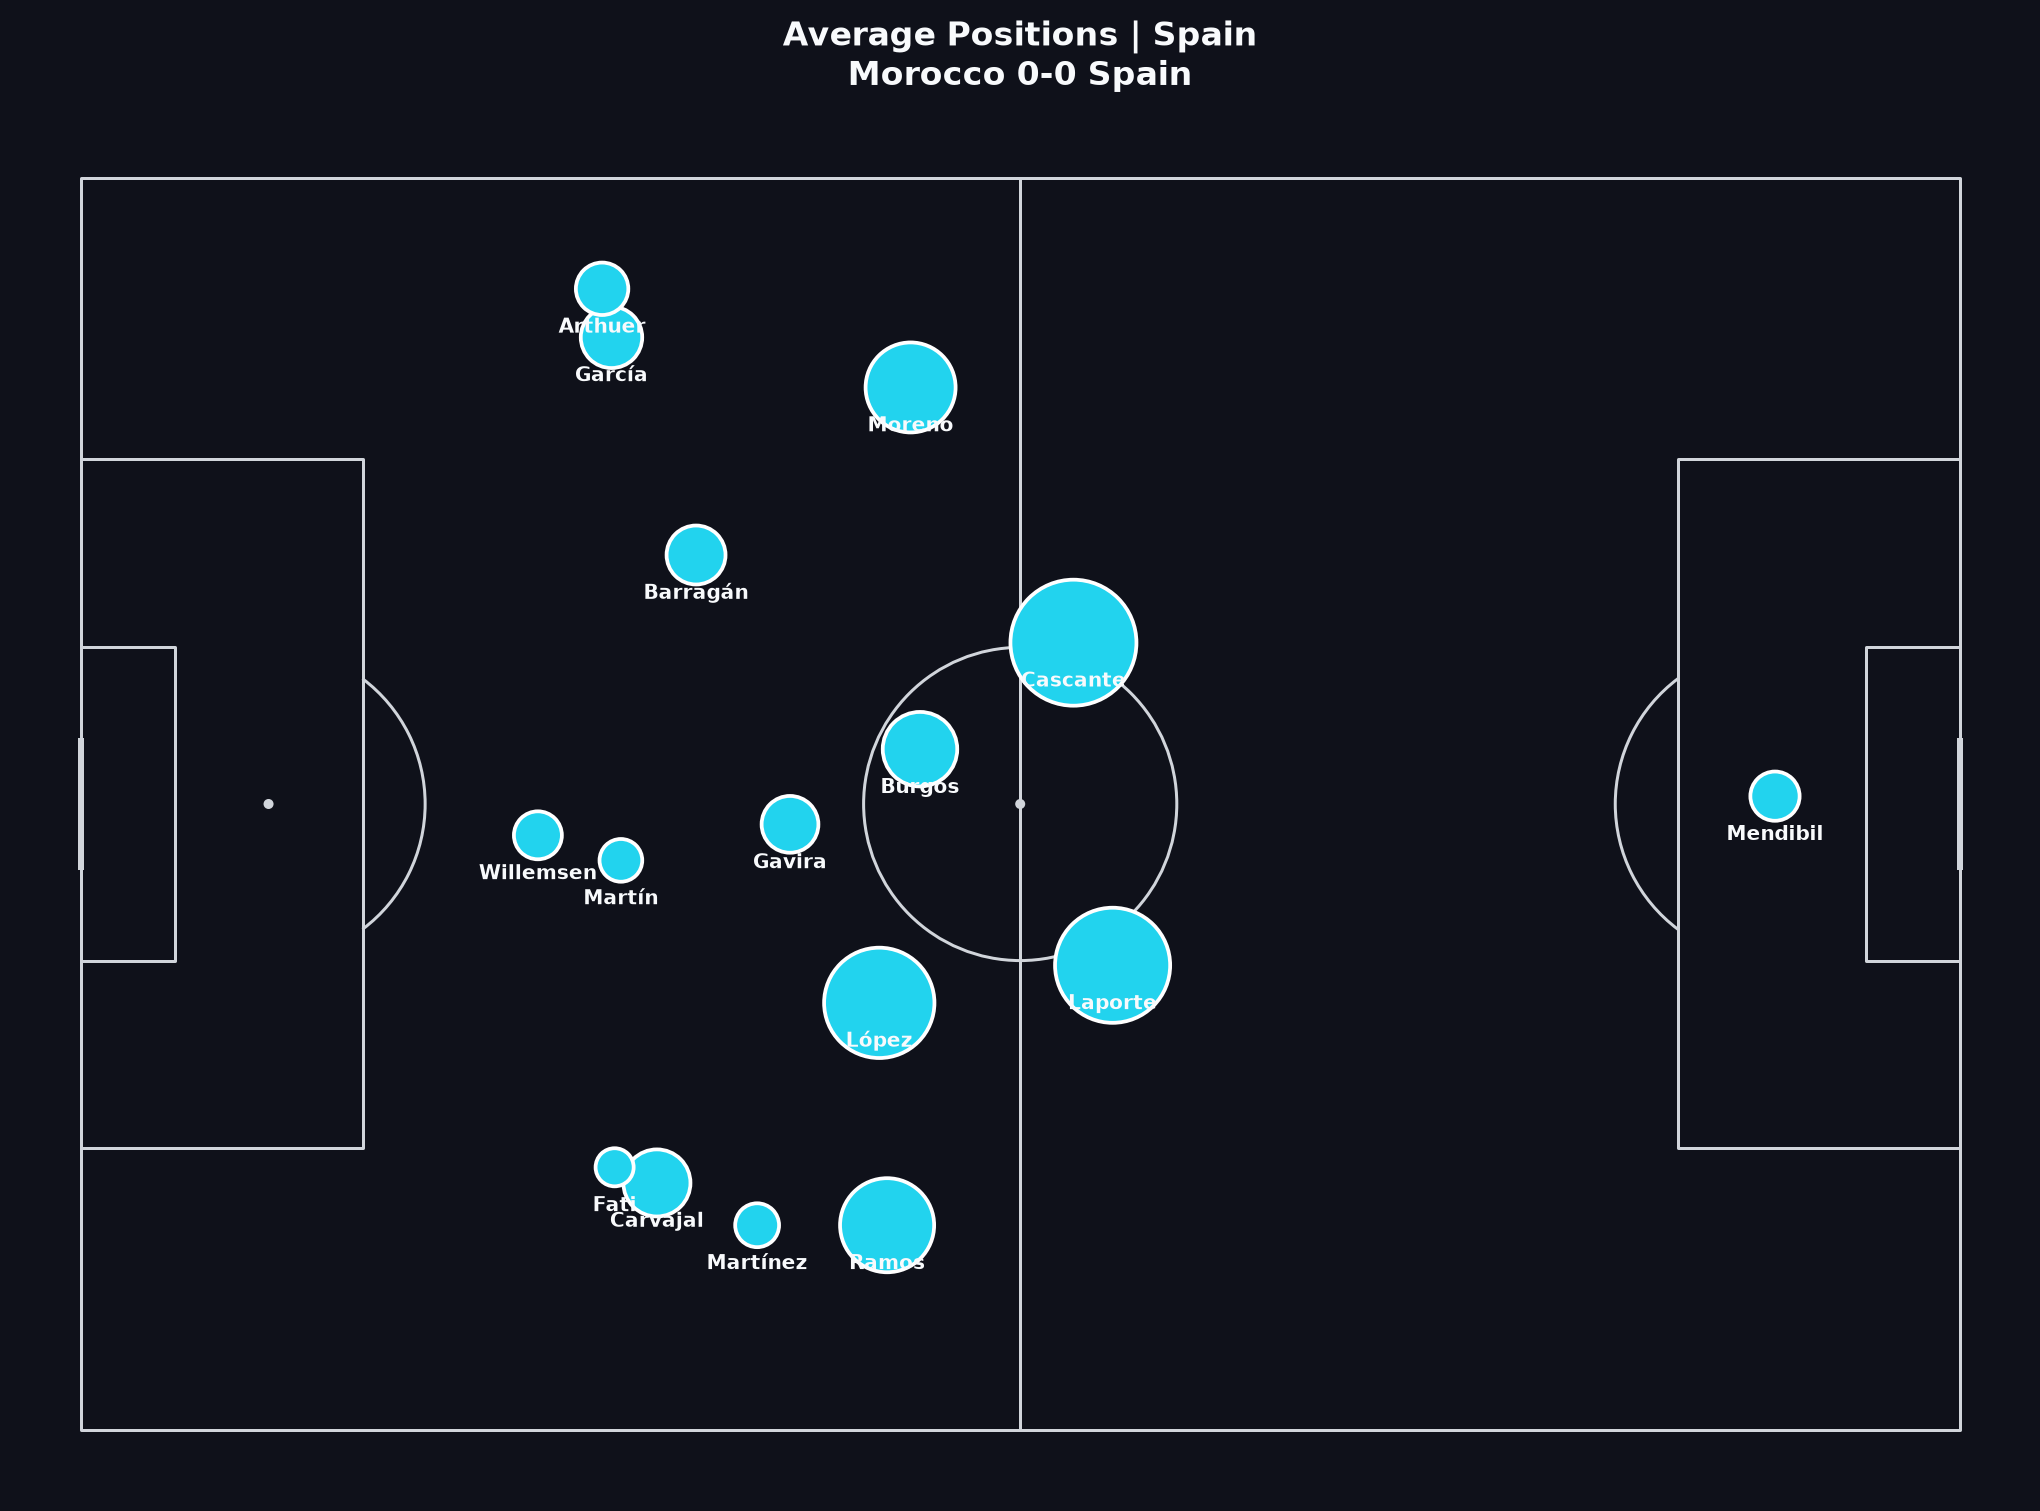
Posições médias
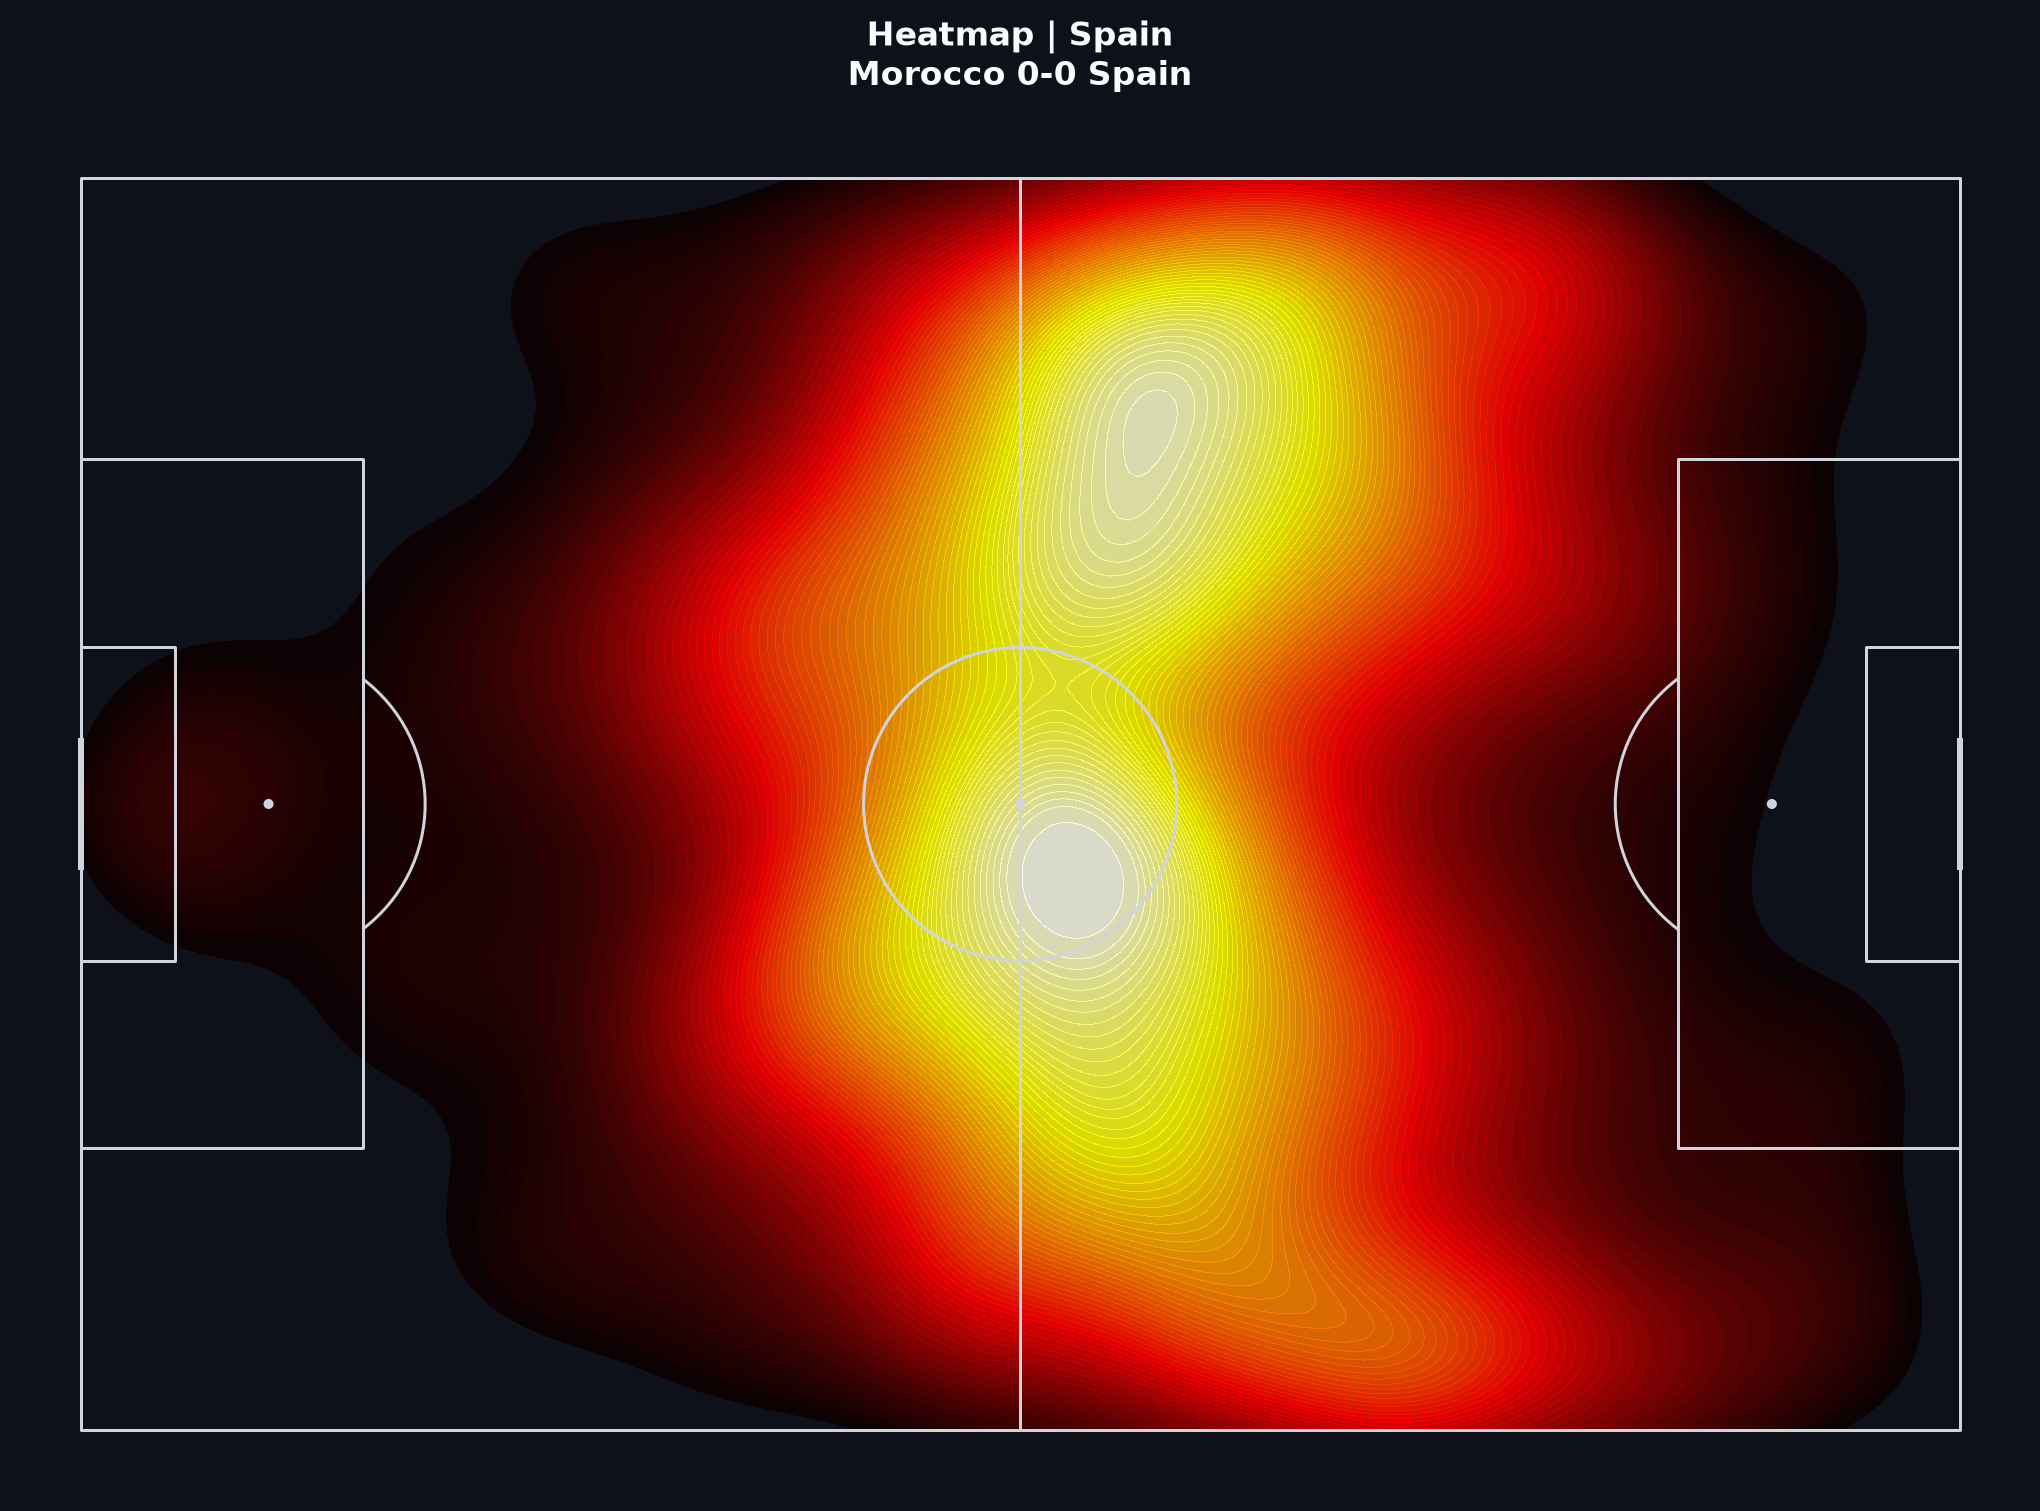
Average positions summarise where on-ball actions clustered. Spain’s picture usually sits higher; Morocco’s often reads as a deeper, compact block — form a hypothesis, then test it on video.
Como ler isto
Detalhes de “Como ler” estão em inglês.
- A deeper Moroccan average block is consistent with absorbing pressure; it is not automatically ‘negative’ football.
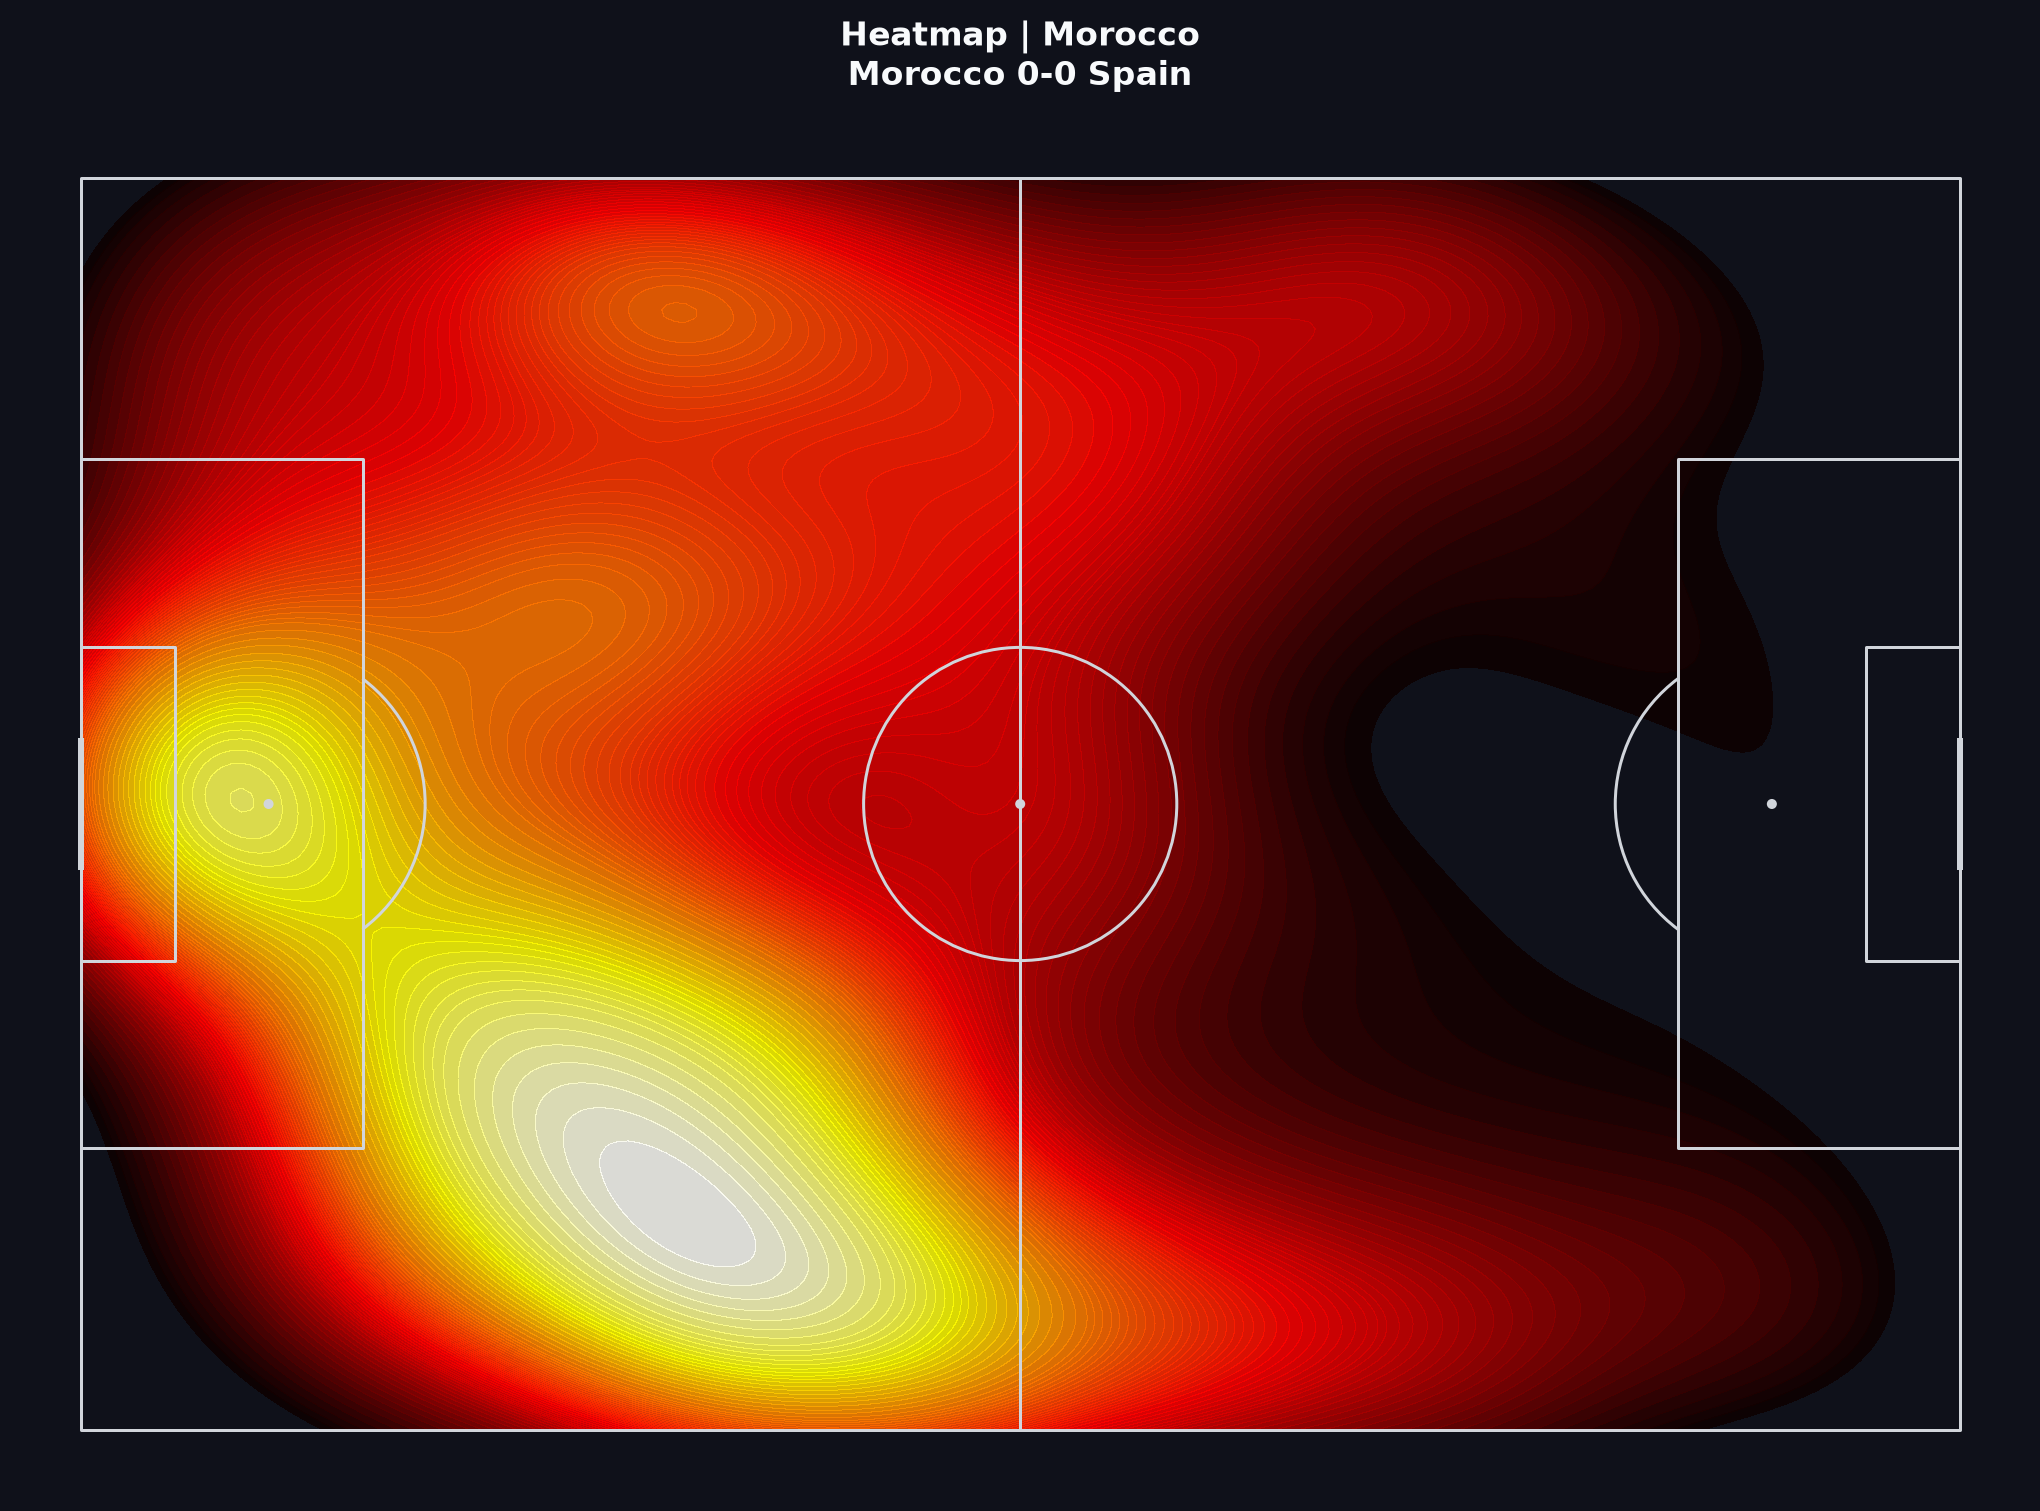
- Spain’s higher involvement height can indicate territorial dominance or repeated entries into the final third — check heatmaps for density, not only point averages.
- Average position ≠ role for every second. Game state across 120 minutes compresses several phases.
- Use heatmaps (below) as density companions: averages compress; heatmaps show where actions piled up.
Lições relacionadas do Aprender
Concluindo
Orientações finais permanecem em inglês para precisão.
A responsible short report would state the question (for example: how Spain’s possession volume related to chance quality against Morocco’s block), show evidence by layer (network → progressive passes → shots), and keep the shoot-out analytically separate.
If you are following the Learn path, write five sentences using only claims these visuals can support — then note what still requires video.
Practice prompt
In 150–200 words: (1) one claim about Spain’s build-up volume versus chance quality, (2) one claim about Morocco’s block or selective progression, (3) one limitation of reading a deep-block match from event data alone. Link each claim to a visual above.
Event data from StatsBomb’s public World Cup 2022 release. Coordinates use StatsBomb’s pitch model.