
比赛实验室 / 2022年国际足联世界杯
决赛 · 2022-12-18
阿根廷 3–3 法国
加时赛后 · 阿根廷点球获胜
卢赛尔体育场 · StatsBomb Open Data
标题与摘要已本地化。下方详细阅读指南为准确性保留英文。
为何这场比赛适合学习
- 比赛广为人知,学习者已熟悉故事线,便于区分叙事与证据。
- 机会创造在上下半场及加时赛中不均衡,需按阶段仔细解读射门地图,而非仅看最终比分。
- 阿根廷的传球网络和推进传球图显示了结构化的推进;法国的末段反应说明比赛状态如何改变画面而不重写早期过程。
- 点球大战位于开放数据文件的第5阶段。将点球射门混入开放比赛xG是常见错误,本场赛事有助于揭示这一点。
比赛背景
阿根廷曾以2-0领先,法国在常规时间末段扳平,双方加时赛各进一球(3-3),随后阿根廷赢得点球大战。
教学时,将常规时间+加时赛(第1至4阶段)视为比赛过程。第5阶段(点球)为不同练习:在特殊规则下的高xG离散尝试。
第1至4阶段(90分钟+加时赛)
以下数据不含点球大战(第5阶段),以避免点球xG扭曲过程解读。
- 阿根廷
- 20 射门 · 3 进球 · ~2.76 xG
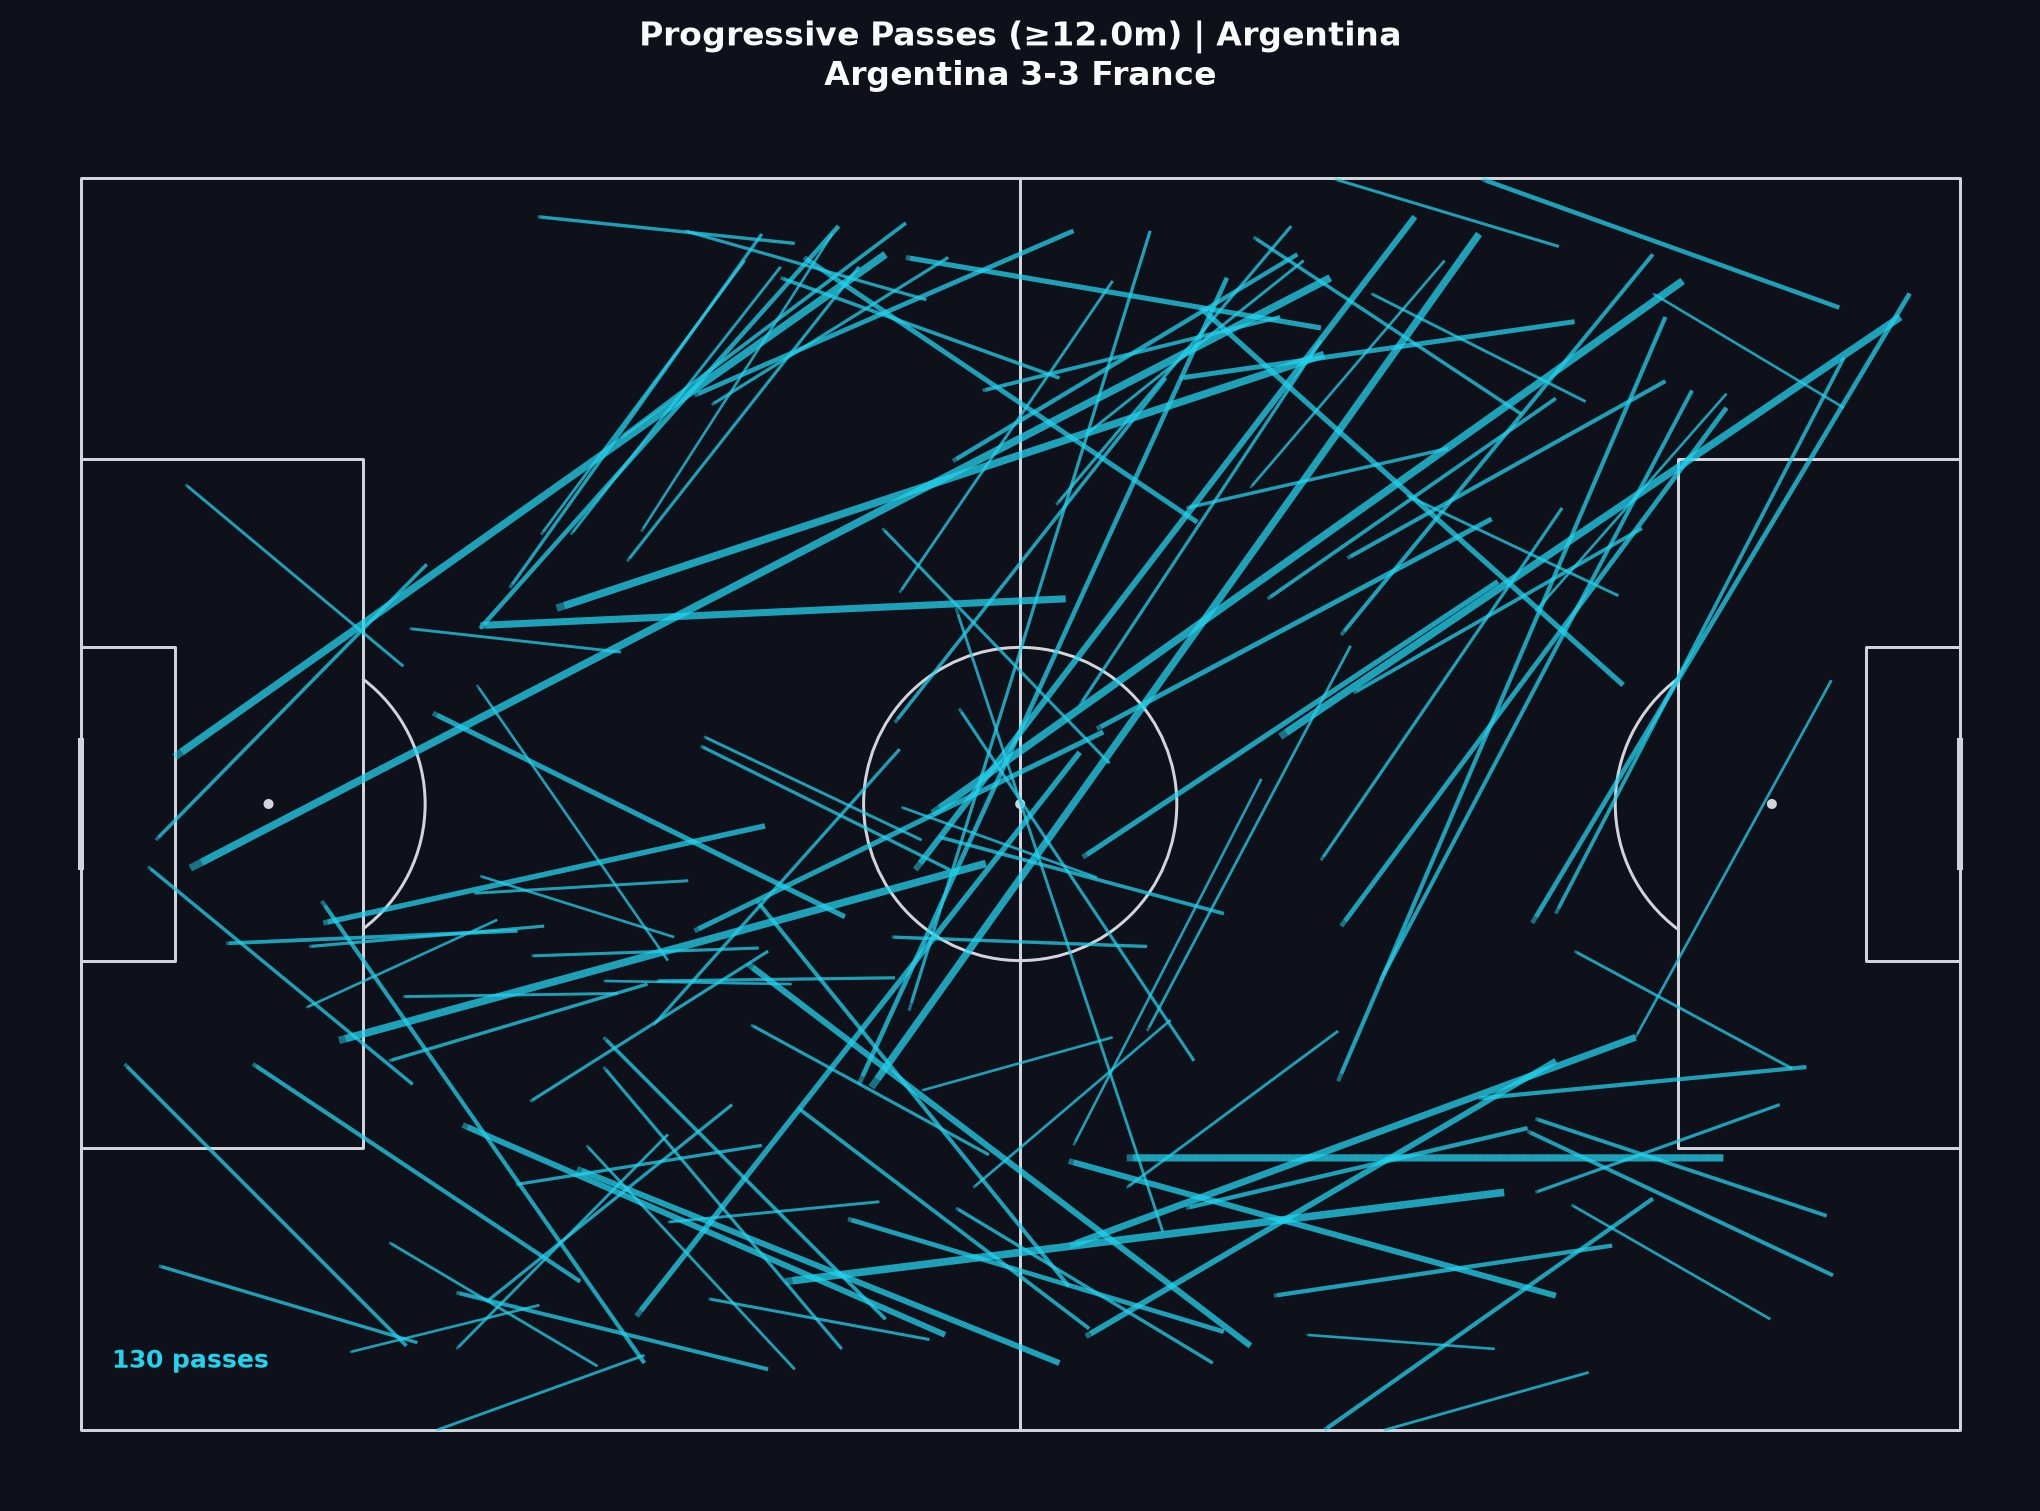
- 推进传球: 130 (23.2% 的传球)
- 法国
- 10 射门 · 3 进球 · ~2.27 xG
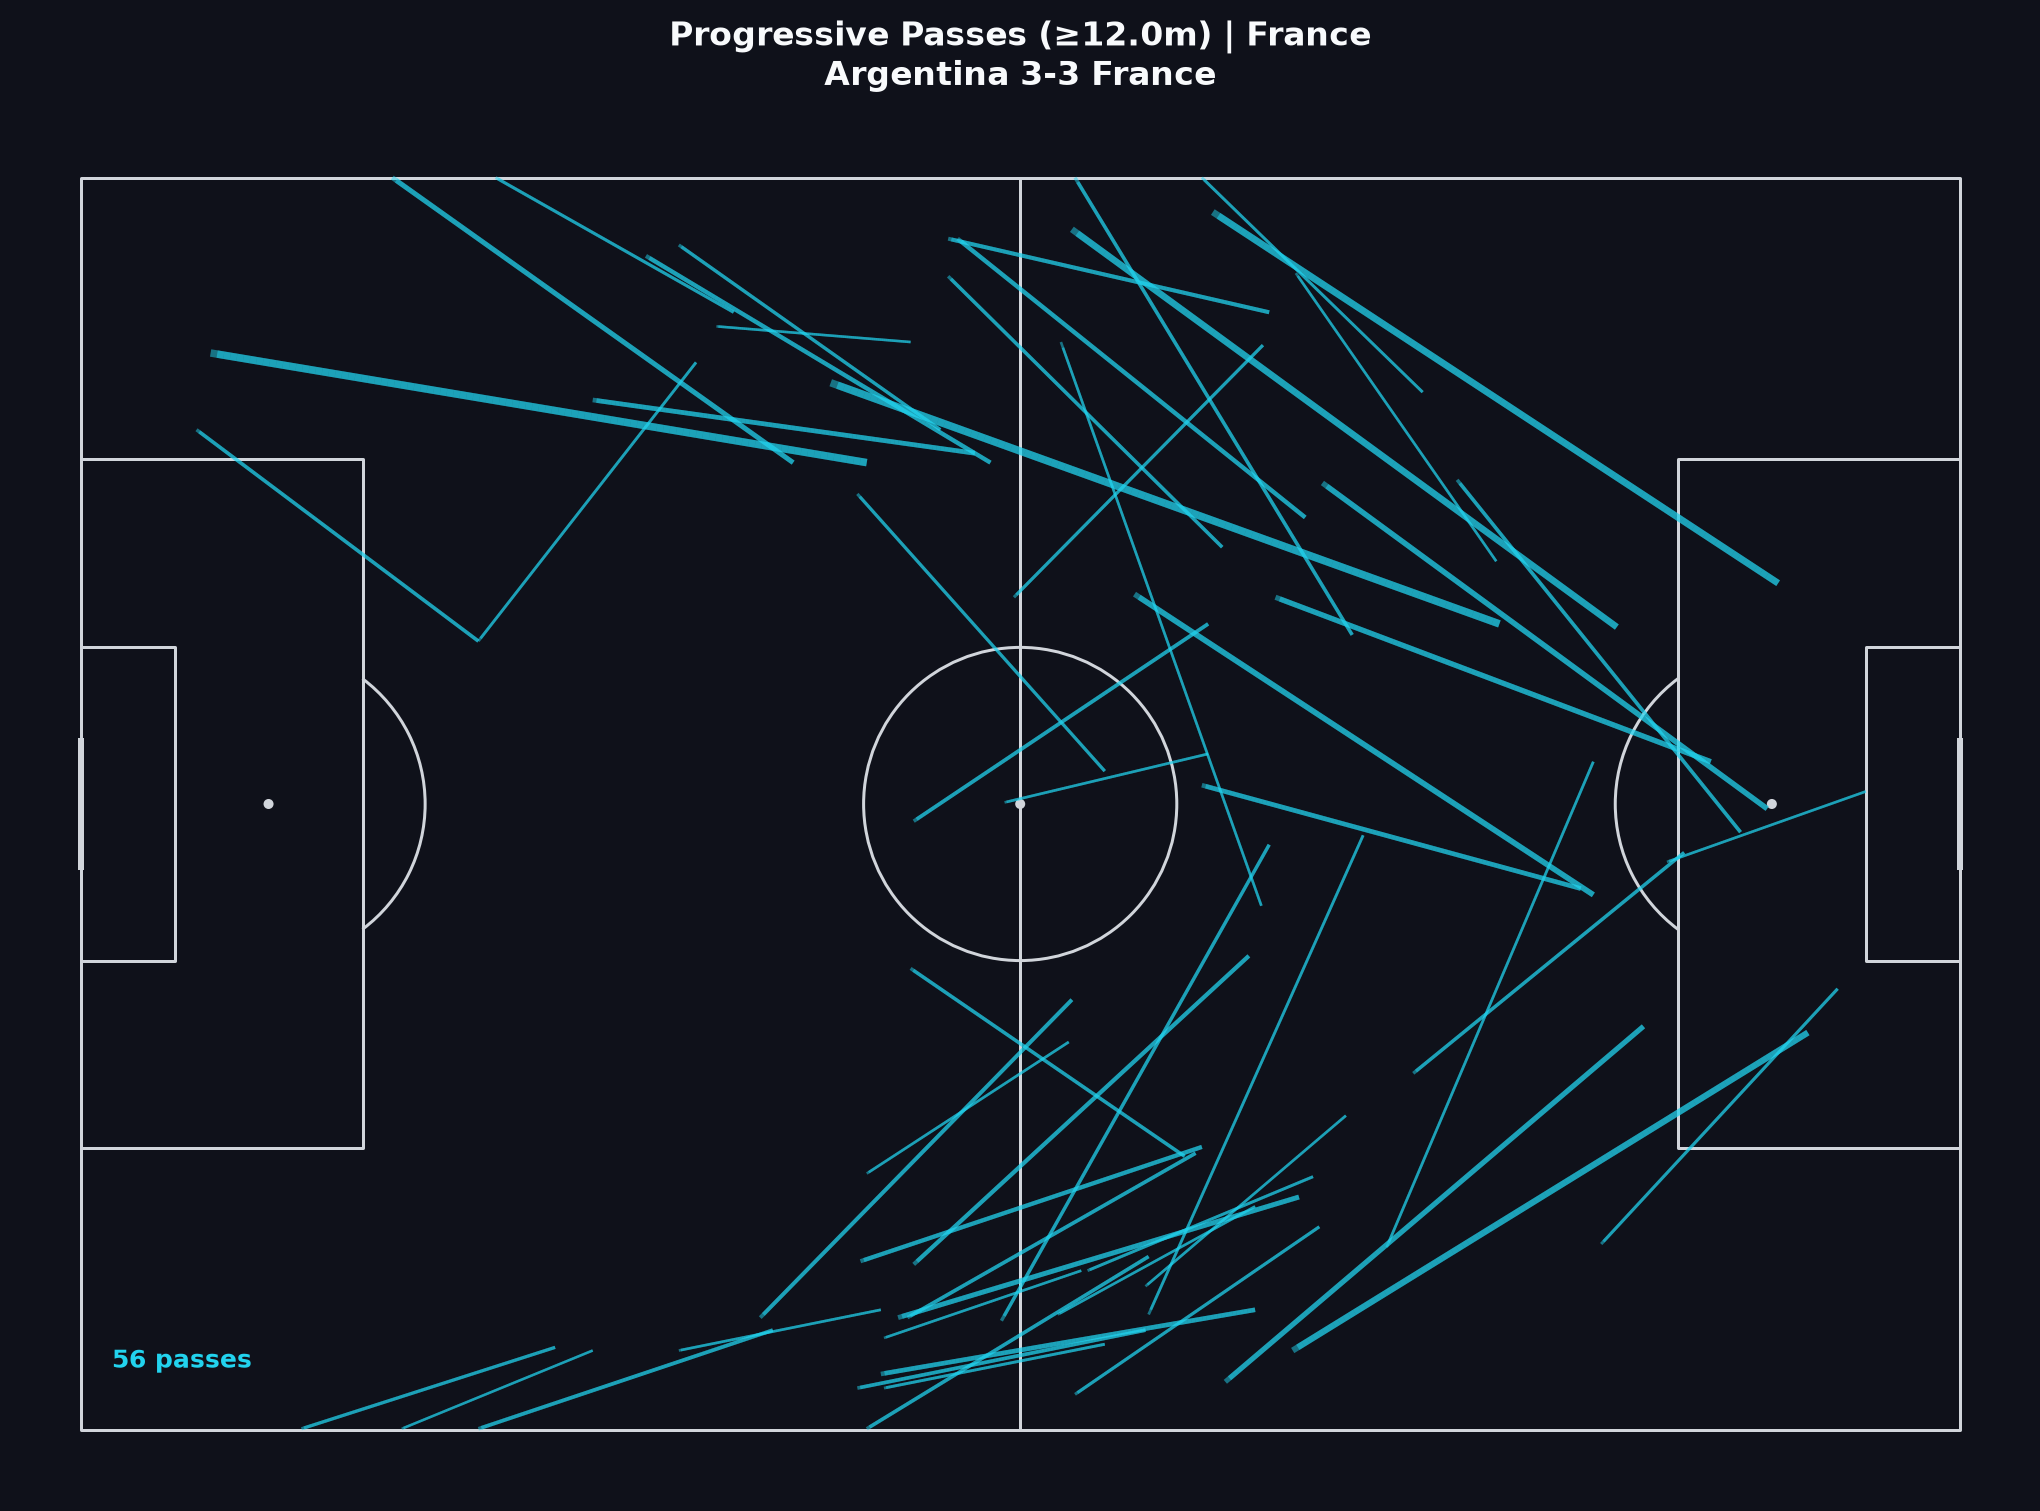
- 推进传球: 56 (12.9% 的传球)
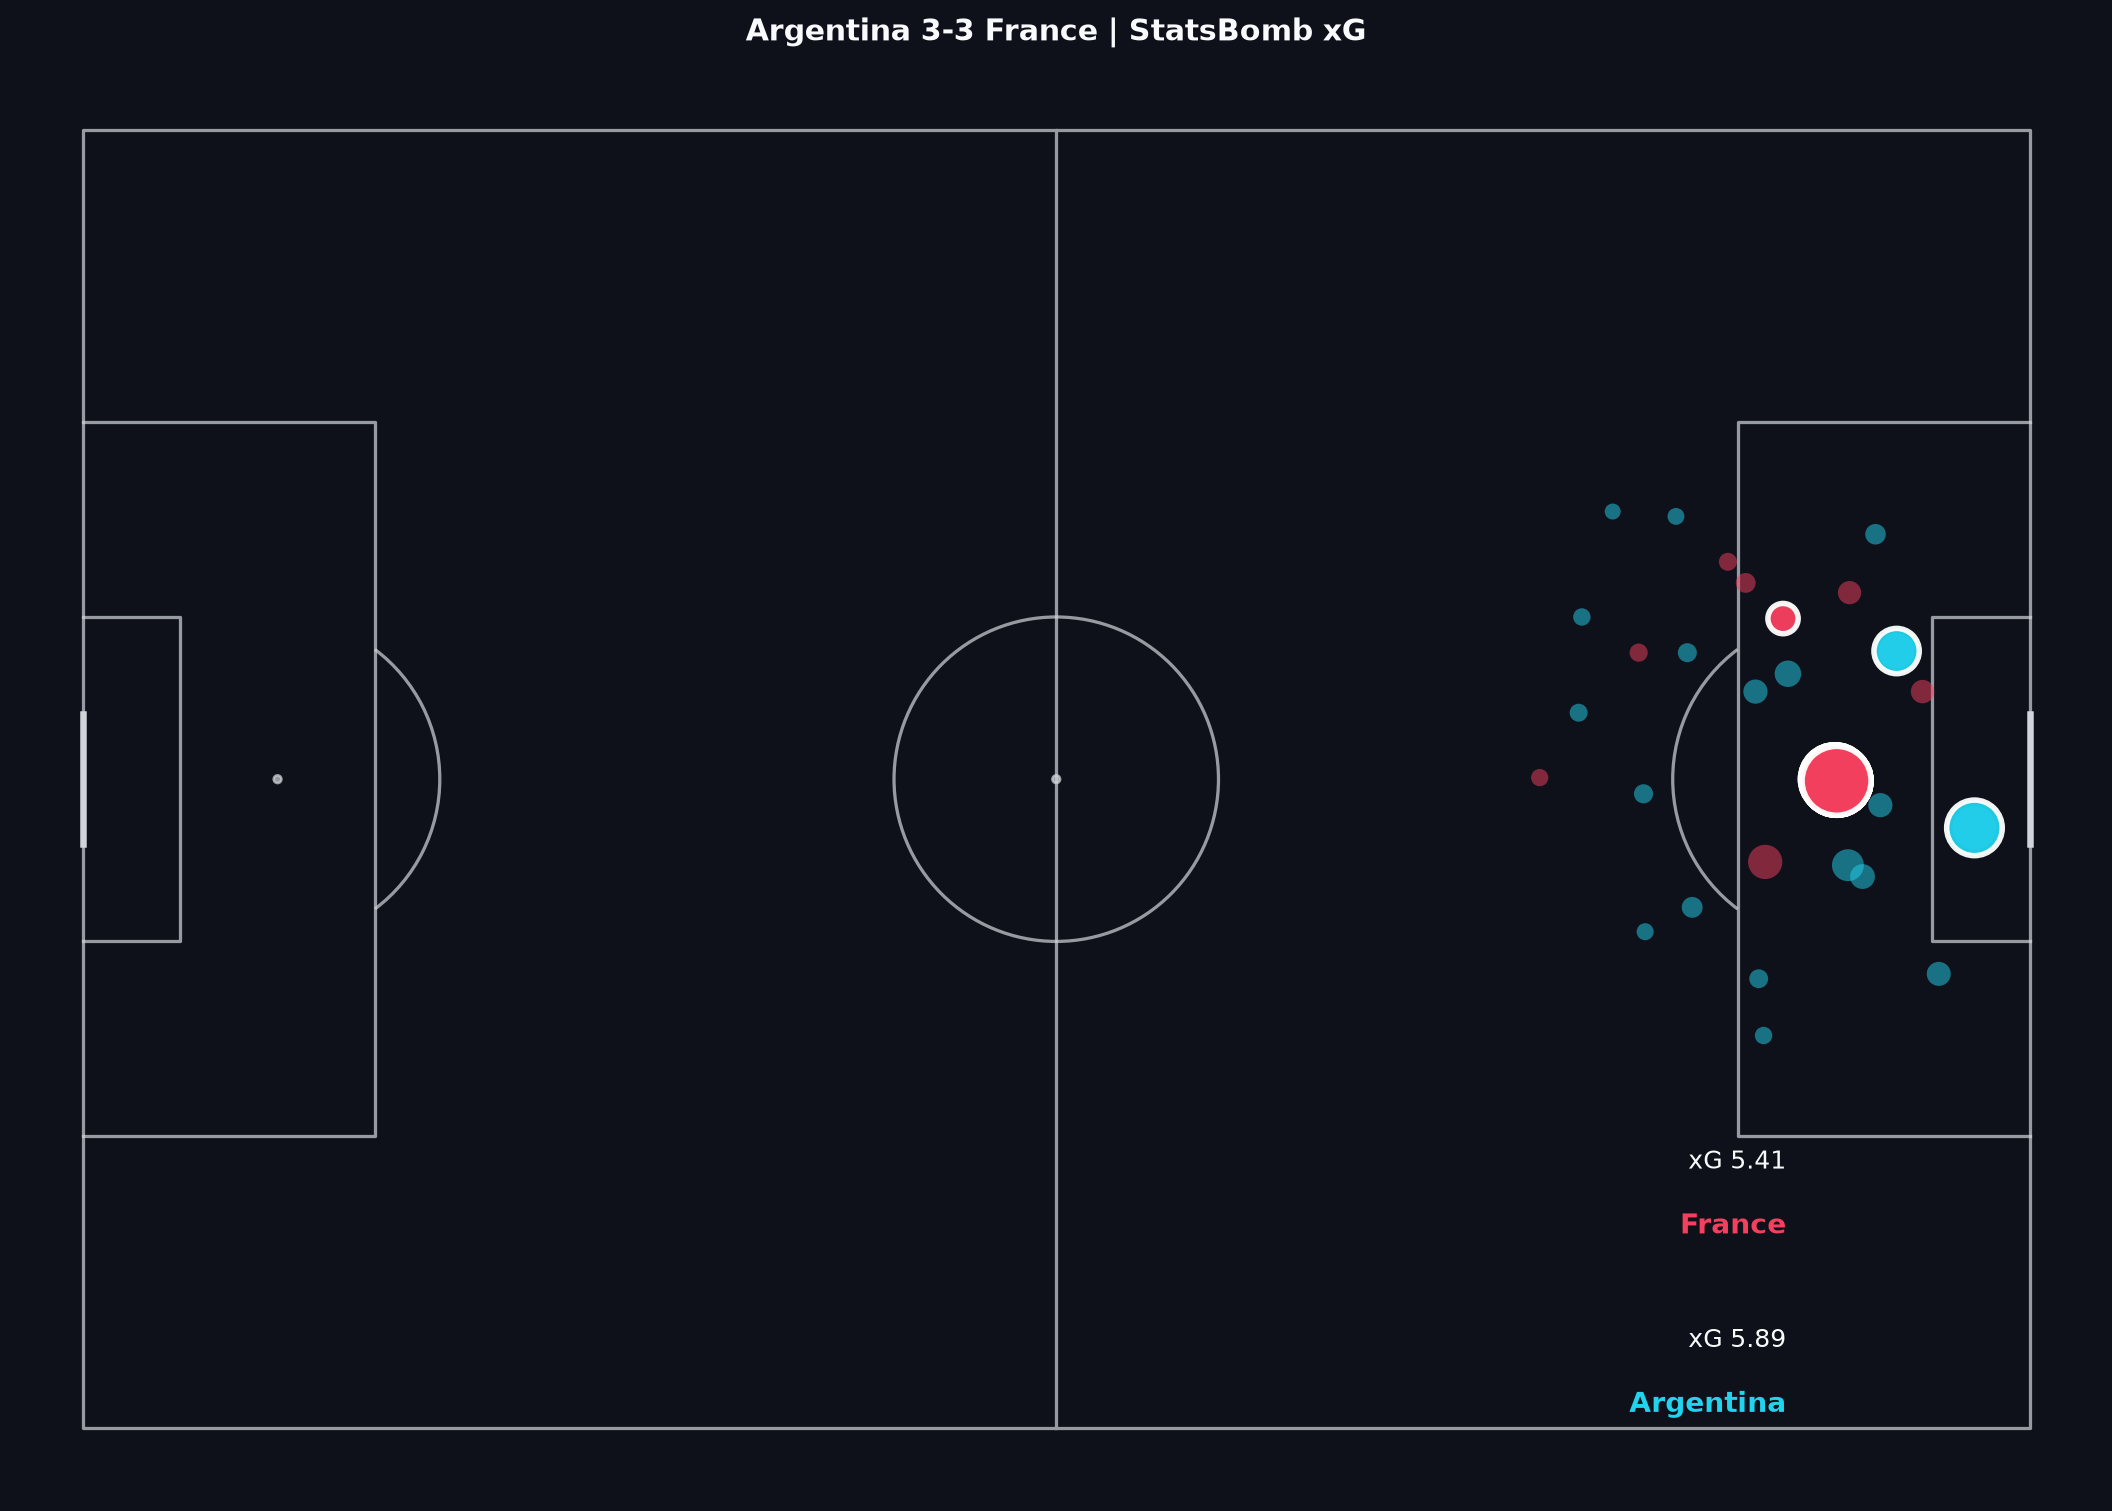
图示 1
射门地图
每个标记代表一次射门。位置、数量和质量比单纯计点更重要。结合上述阶段说明解读:先看过程,再看点球。
如何阅读
详细的“如何阅读”条目为英文。
- Start with location clusters, not the scoreline. Central box attempts usually carry more historical goal probability than speculative efforts from distance.
- Compare volume and quality together. Argentina recorded more shots in periods 1–4; France’s conversion relative to fewer attempts is part of the late-game story, not proof that earlier Argentine control ‘did not matter’.
- Ask which chances came from open play versus set pieces, and whether a cluster reflects sustained territorial pressure or a short burst.
- Do not invent a formation story the map cannot prove. A shot map shows outcomes of chances, not every off-ball run that created them.
相关 Learn 课程
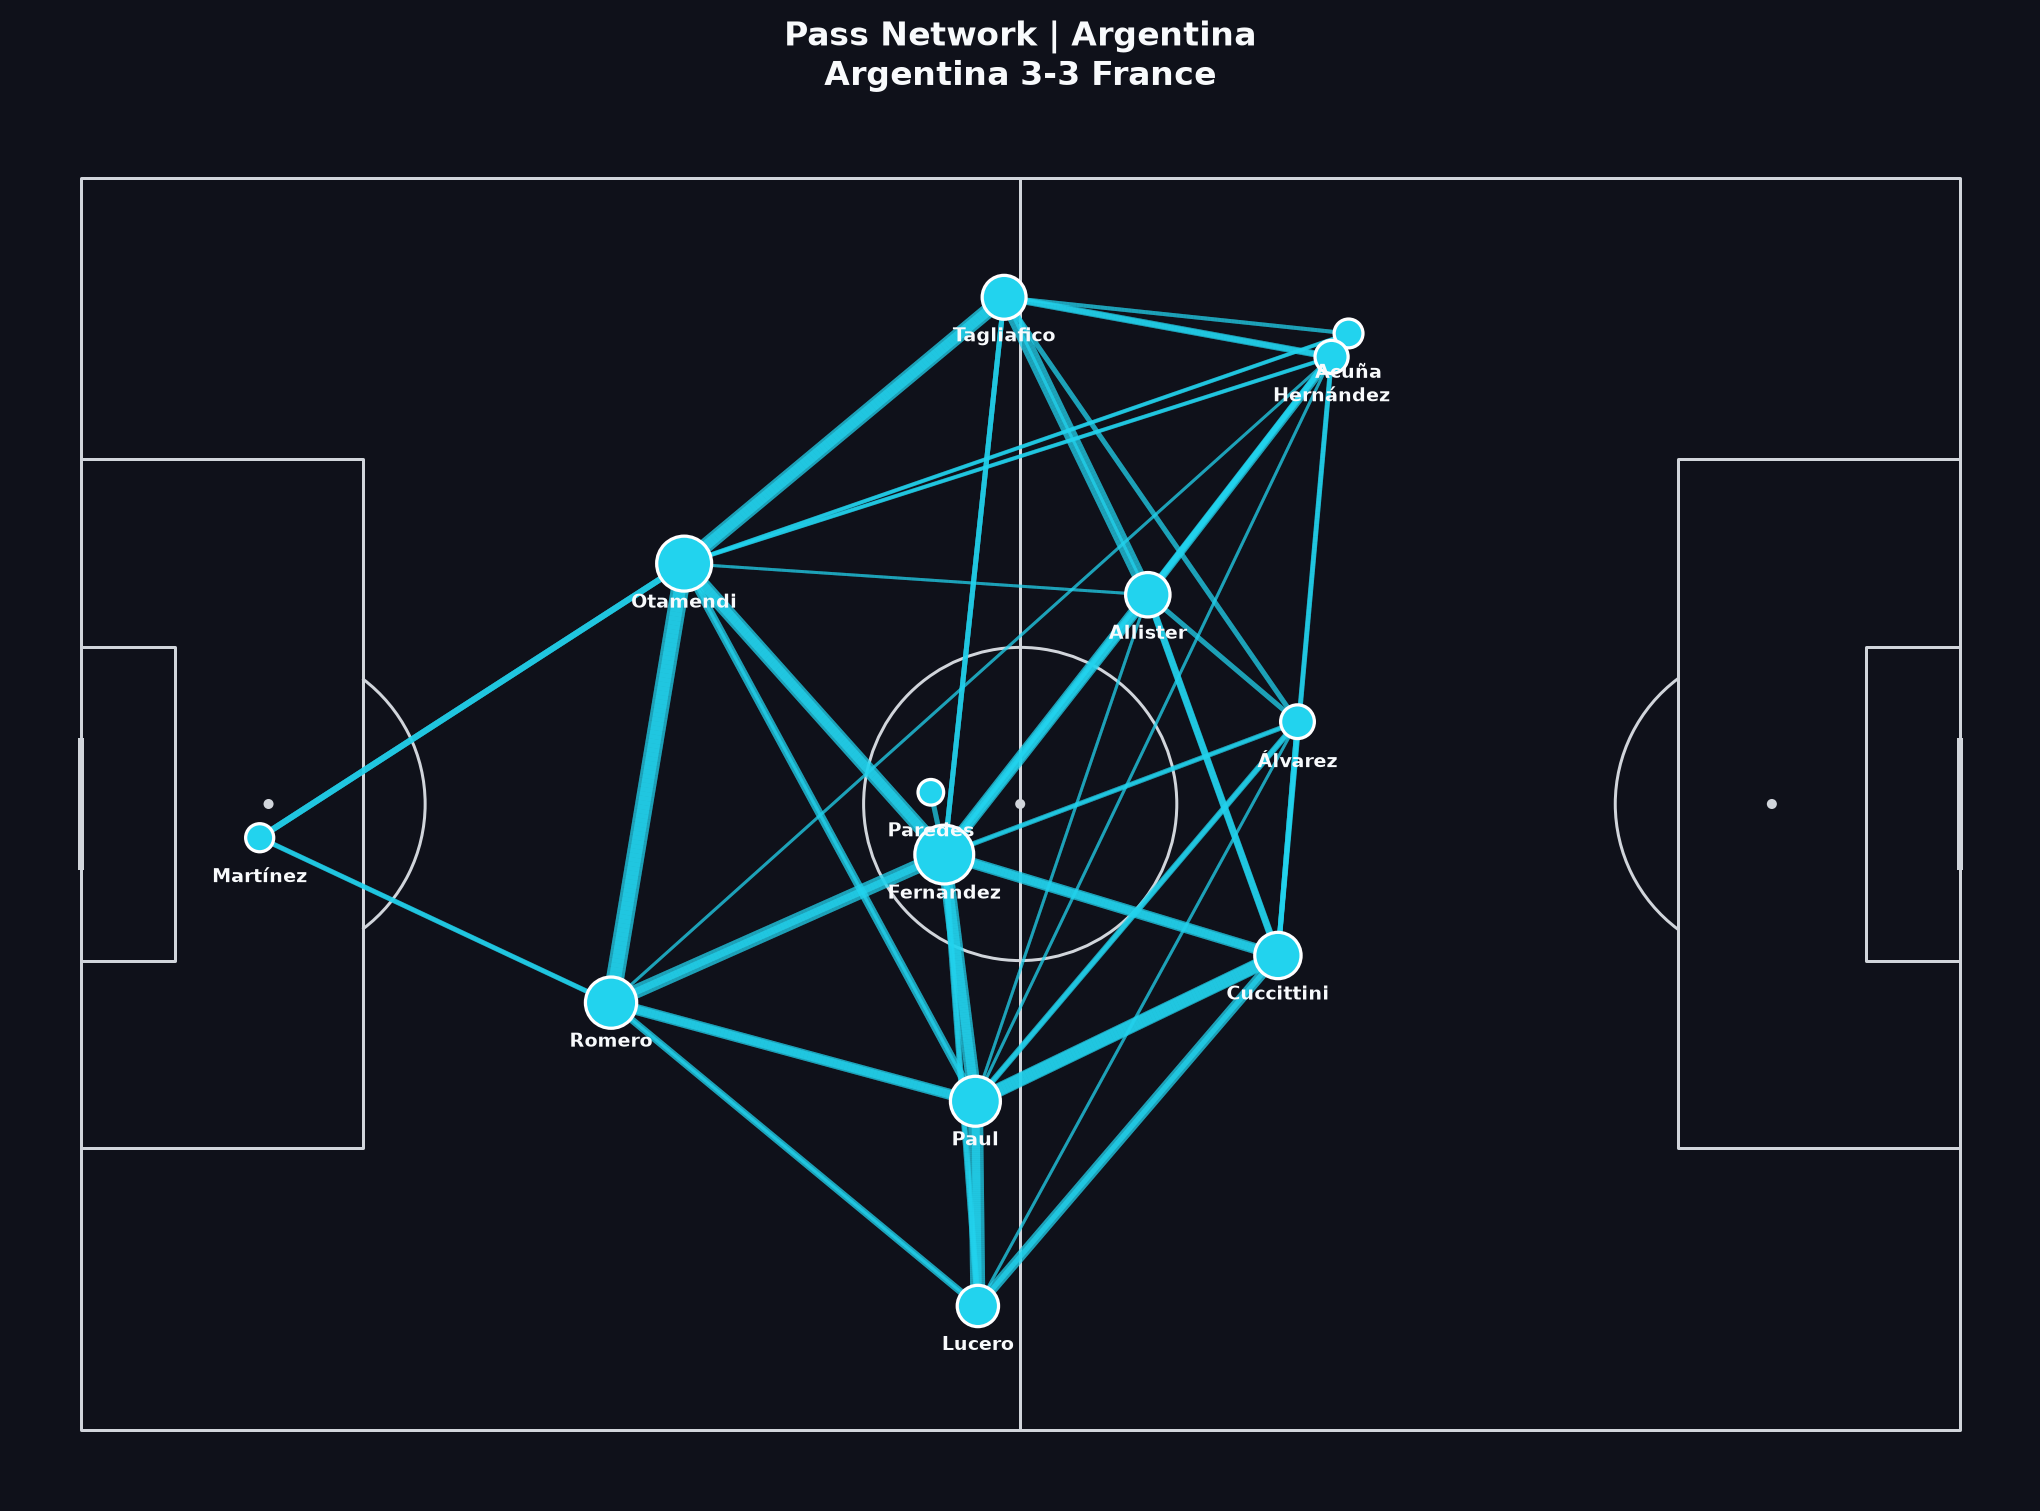
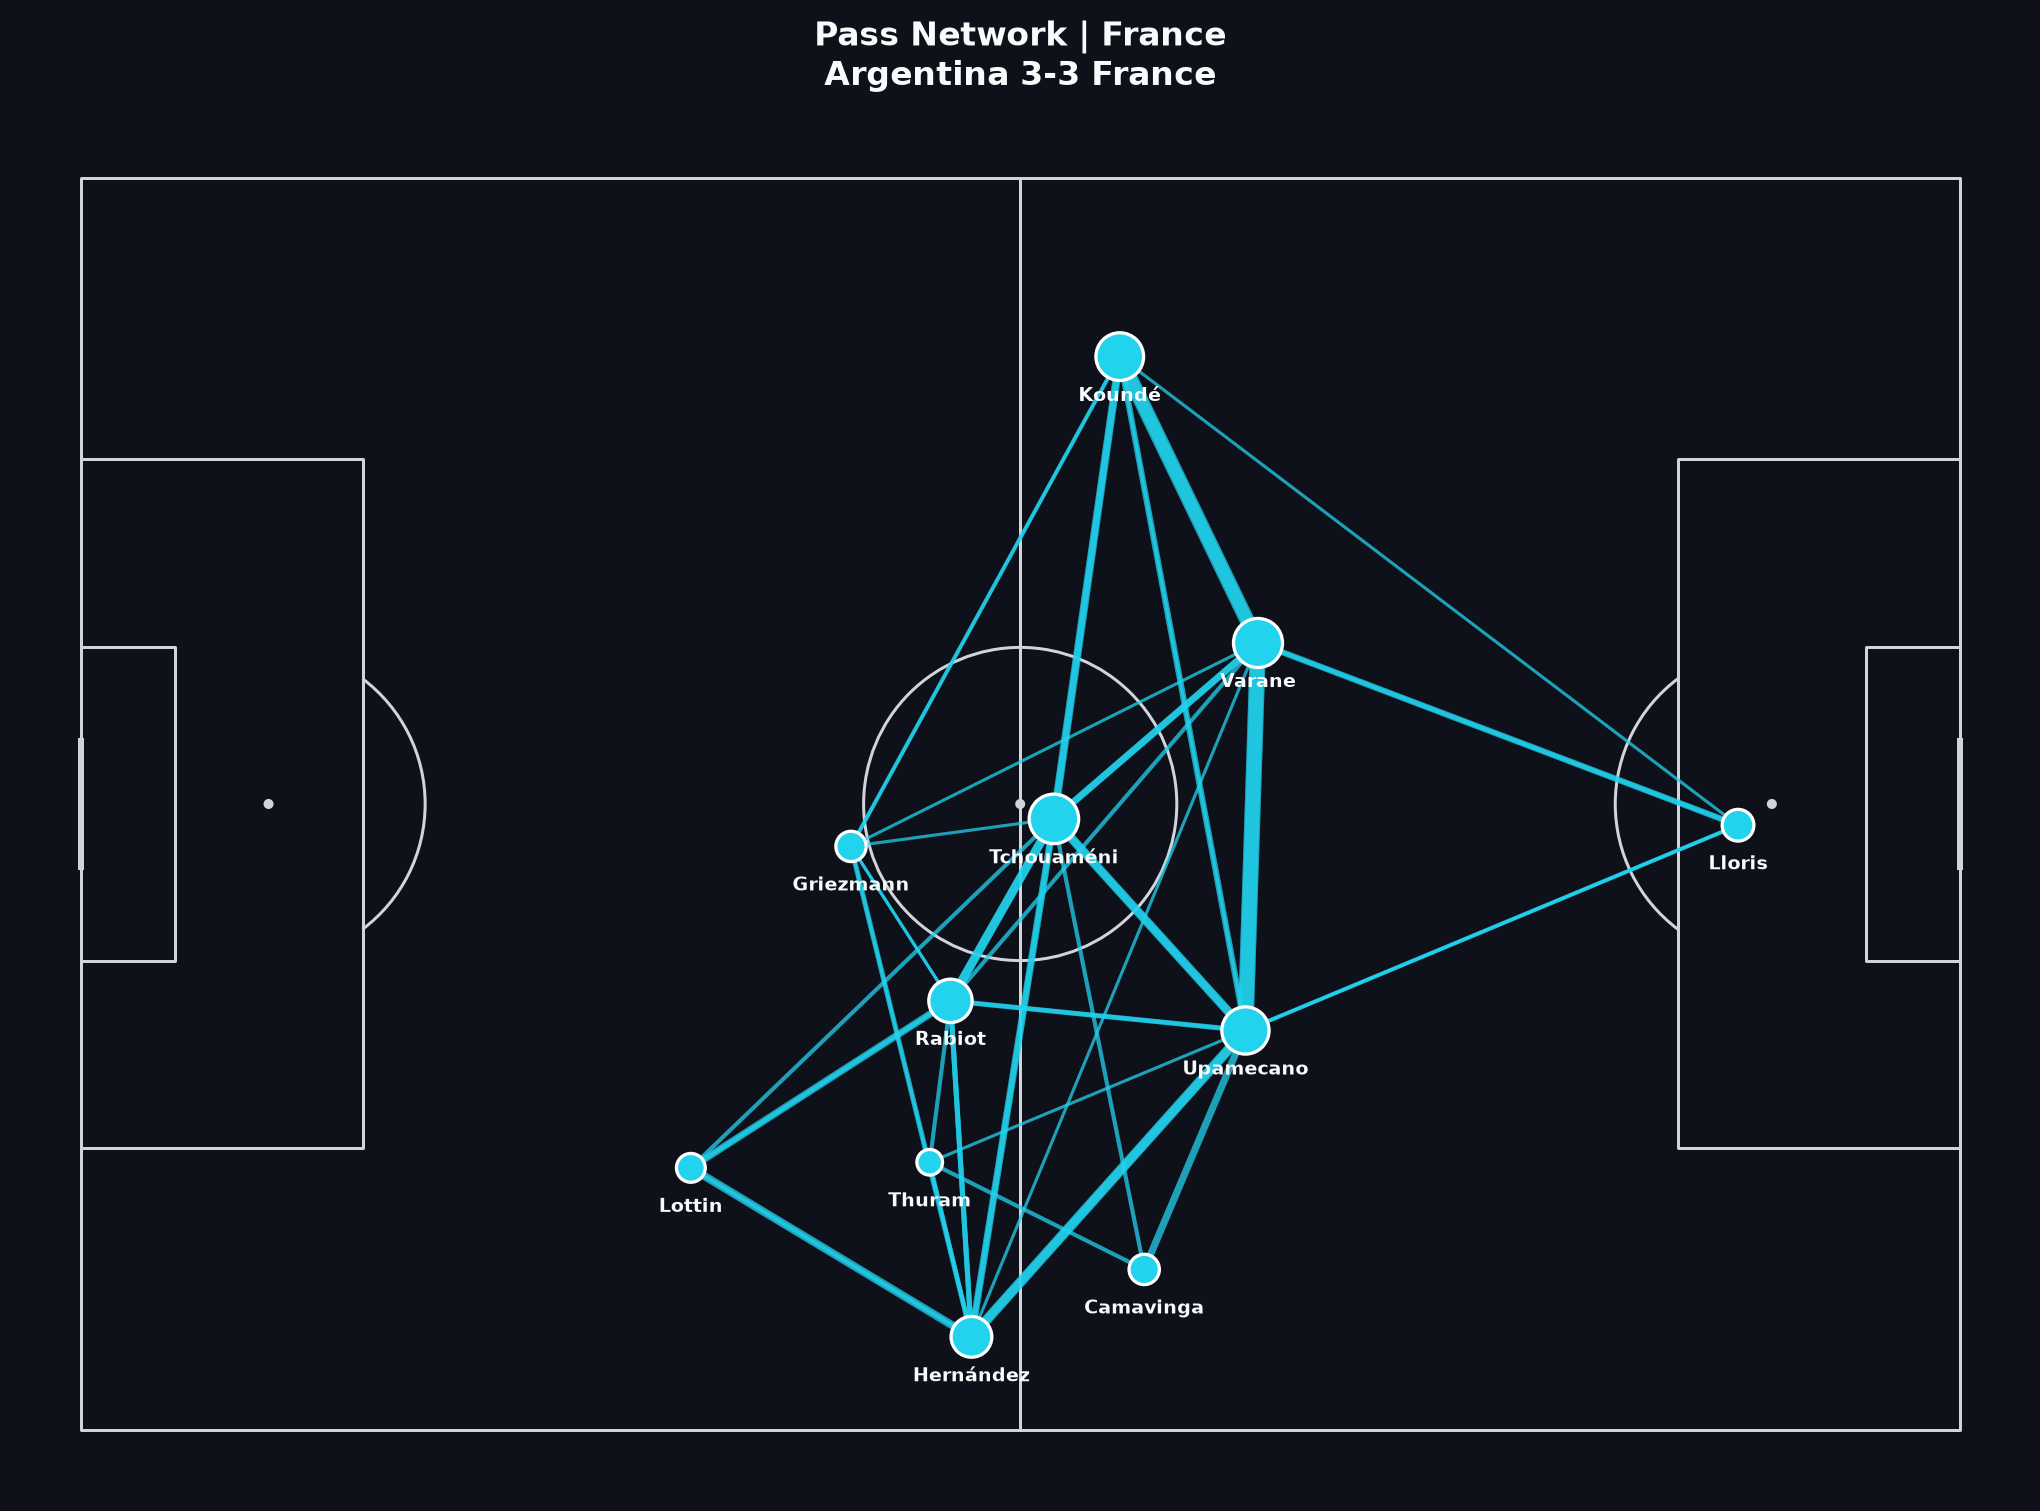
图示 2
传球网络
节点代表球员(平均持球位置);边表示完成的传球连接。较粗或较强的连接通常意味着更频繁的配合,但不自动代表更优足球。
如何阅读
详细的“如何阅读”条目为英文。
- Look for hubs and corridors. Who receives in central zones? Who connects the first line to the final third?
- A dense network on one flank can mean intentional overloads — or forced circulation away from pressure. Confirm with video before naming a ‘plan’.
- Compare Argentina’s denser progressive structure with France’s more selective connections. Difference in volume is informative; it is not a moral ranking.
- Substitutions and game state change networks. A final with long extra time mixes several match phases into one average picture.
相关 Learn 课程
图示 3
推进传球
推进传球指在足球AI定义下,至少向对方球门推进约12米的有效传球。它们有助于区分无效控球与实质性领地推进。
如何阅读
详细的“如何阅读”条目为英文。
- High progressive volume suggests a team repeatedly advanced the ball; it does not guarantee high-quality shots at the end of those advances.
- Argentina’s progressive share (~23% of passes in this rendering) is substantially higher than France’s (~13%). Read that as a process difference across the match file, then ask when France’s dangerous moments arrived.
- Trace start and end zones. Progression into the half-space or box carries different tactical meaning from sideways progress near halfway.
- Pair this map with the shot map: progression without shots can be sterile control; shots without progression can be transition or set-piece dependent.
相关 Learn 课程
图示 4
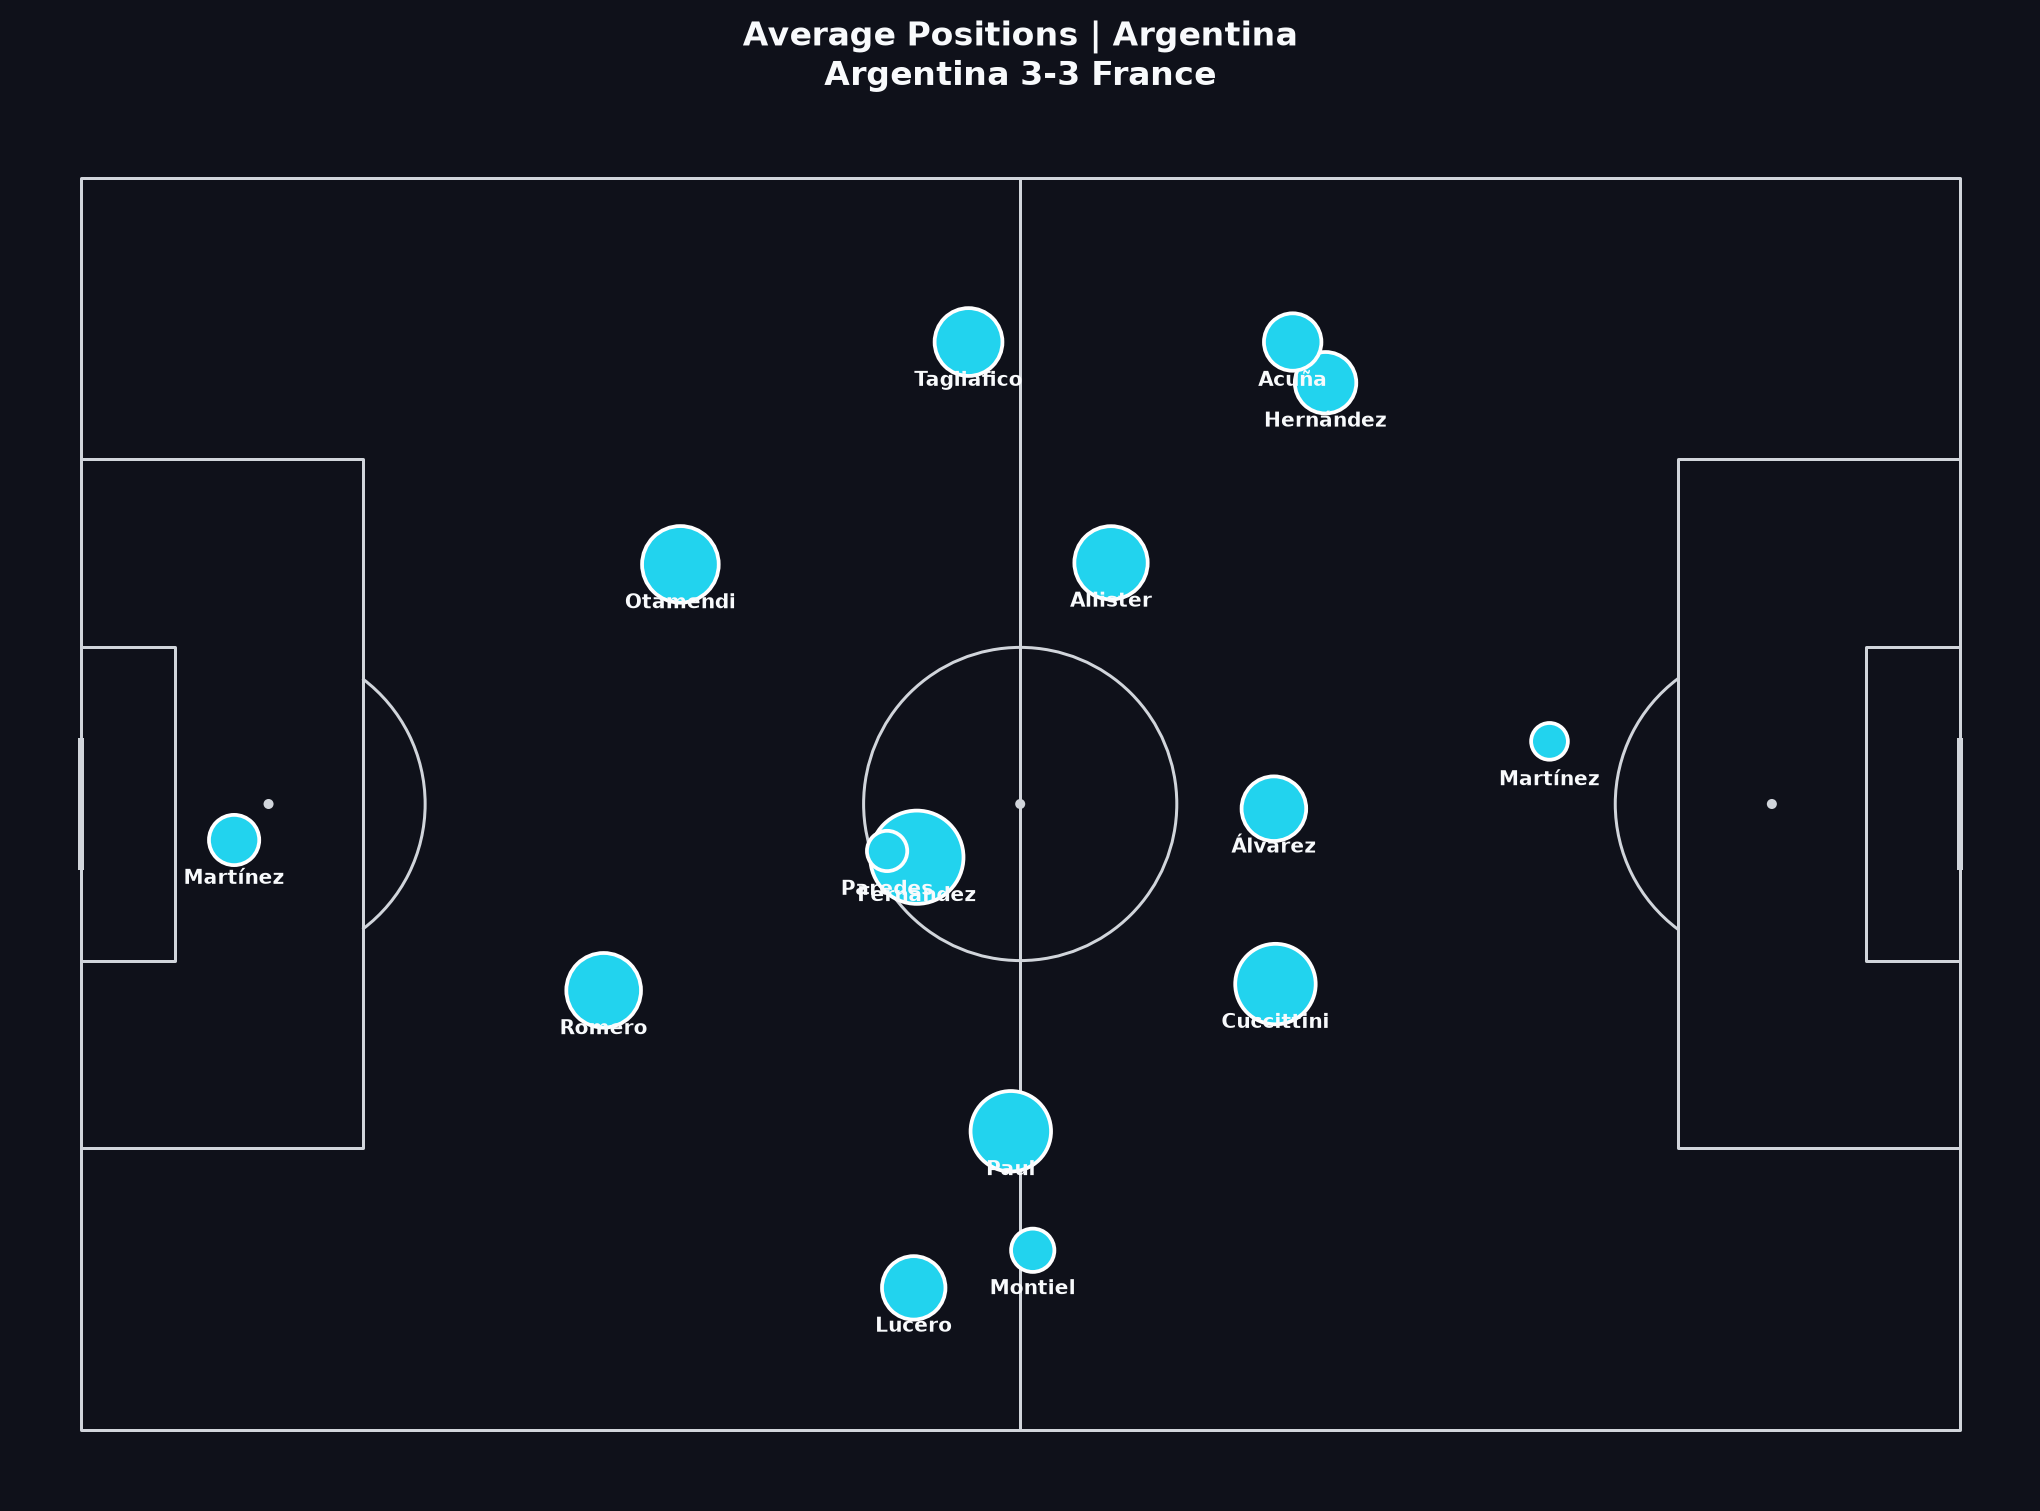
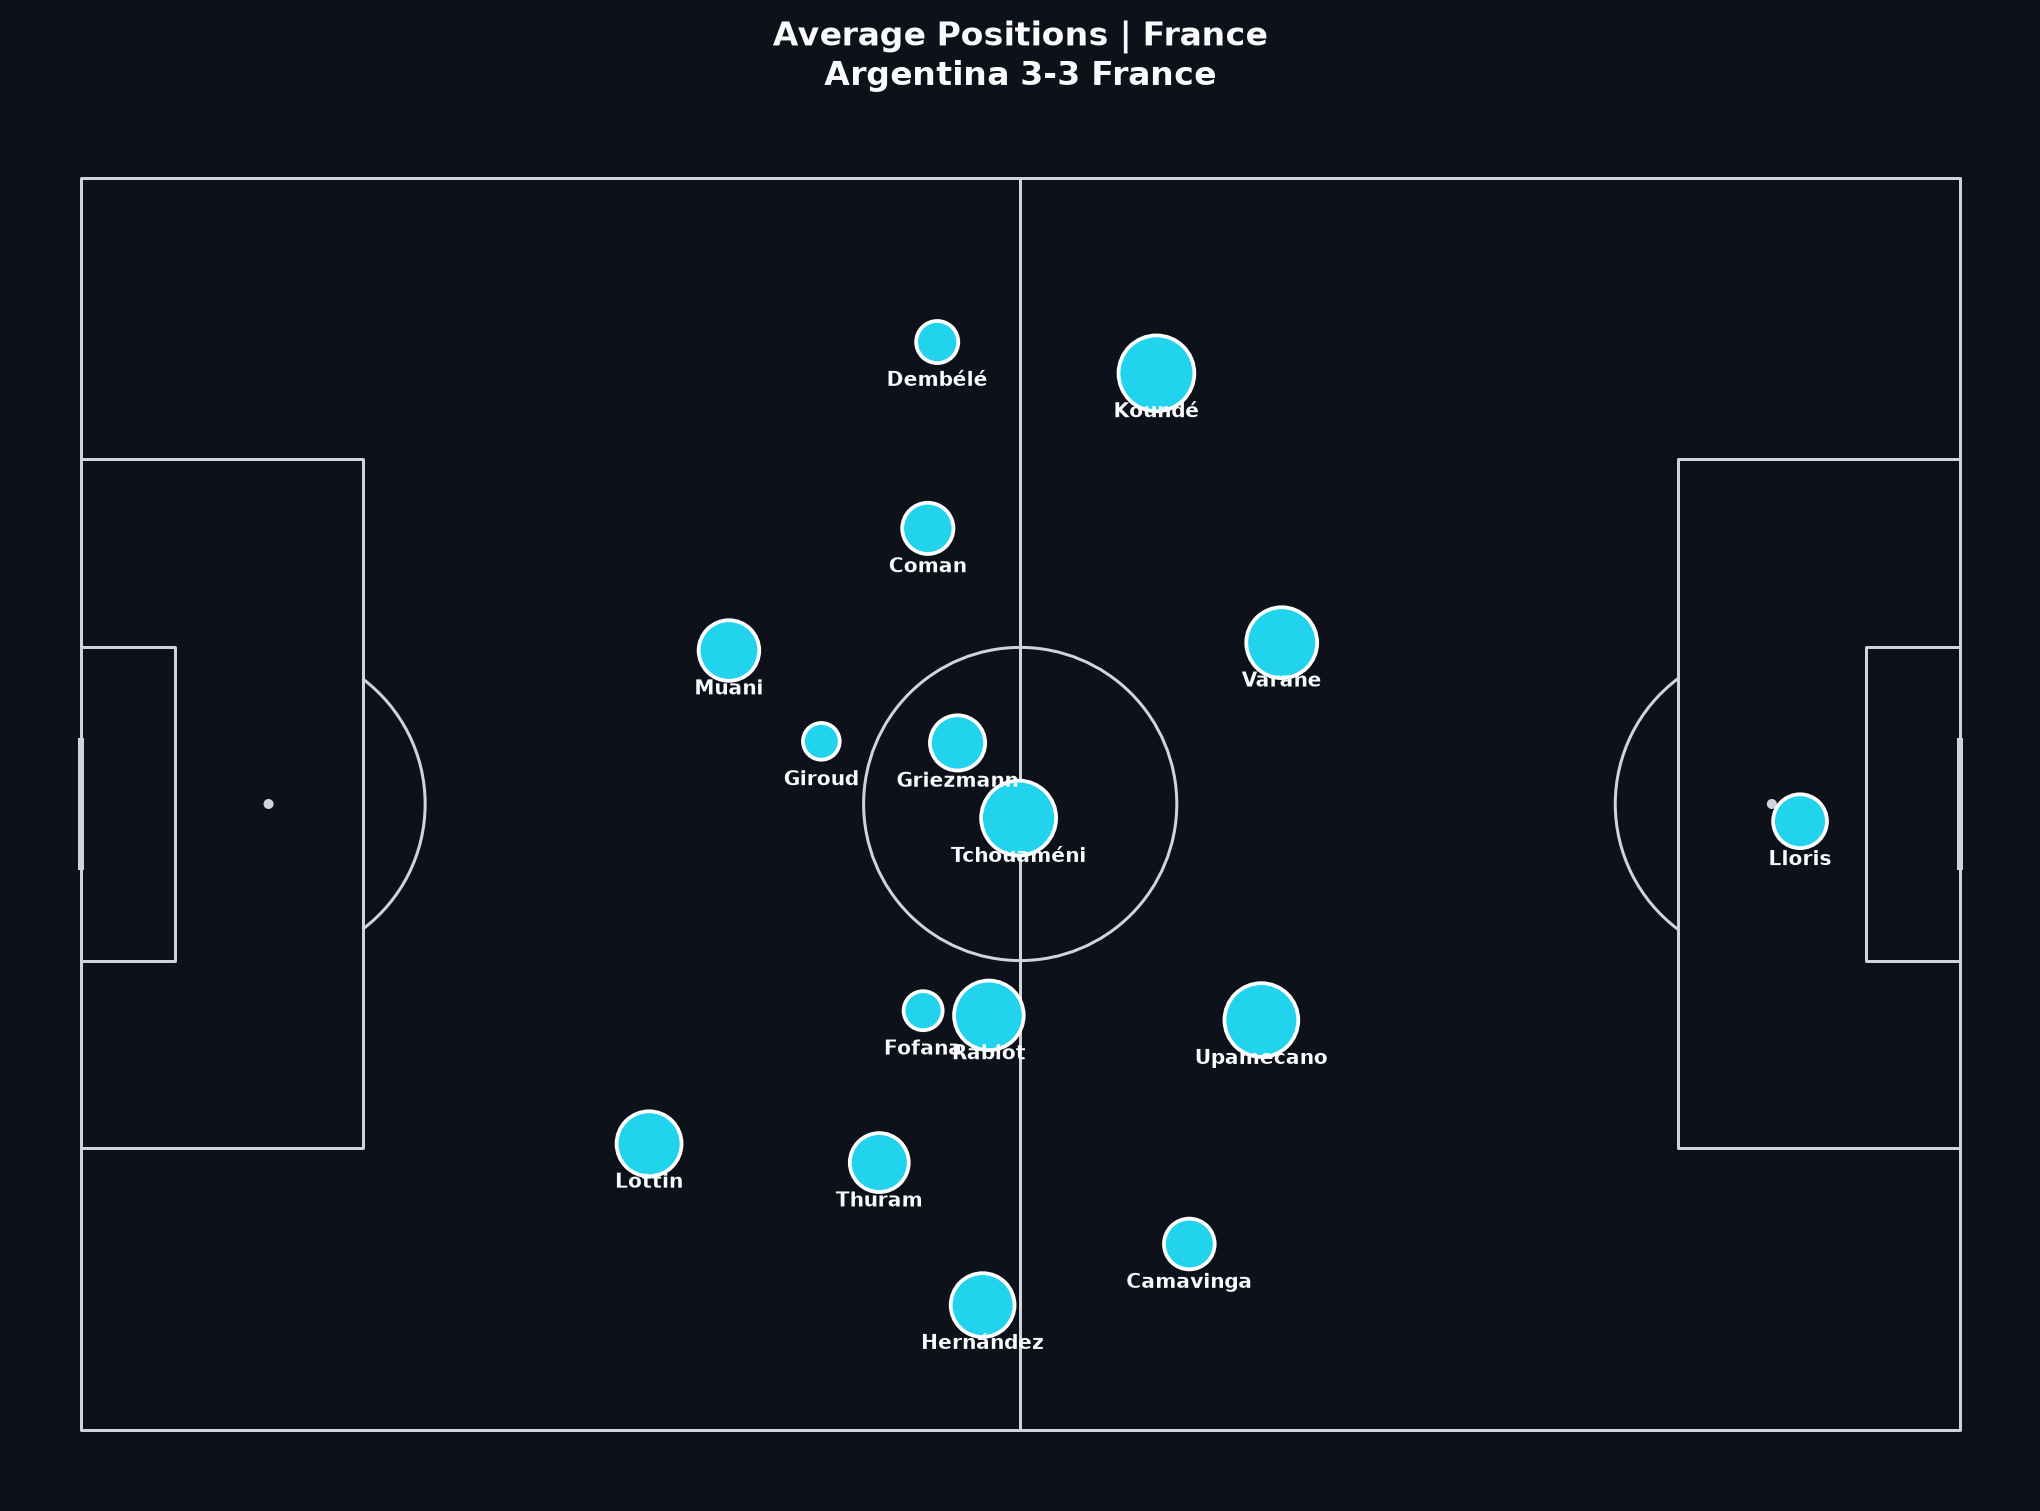
平均位置
标记显示球员足够动作的平均持球位置。这不是战术板上的阵型图,而是参与位置的空间总结。
如何阅读
详细的“如何阅读”条目为英文。
- Average position ≠ tactical role for every second. A full-back who inverts late will still leave a trail of earlier wide actions in the average.
- Use the plot to form hypotheses about height of engagement and central occupation, then test them on video clips.
- Compare the two sides’ vertical height. A higher average block can indicate territorial dominance or chasing a deficit — match state matters.
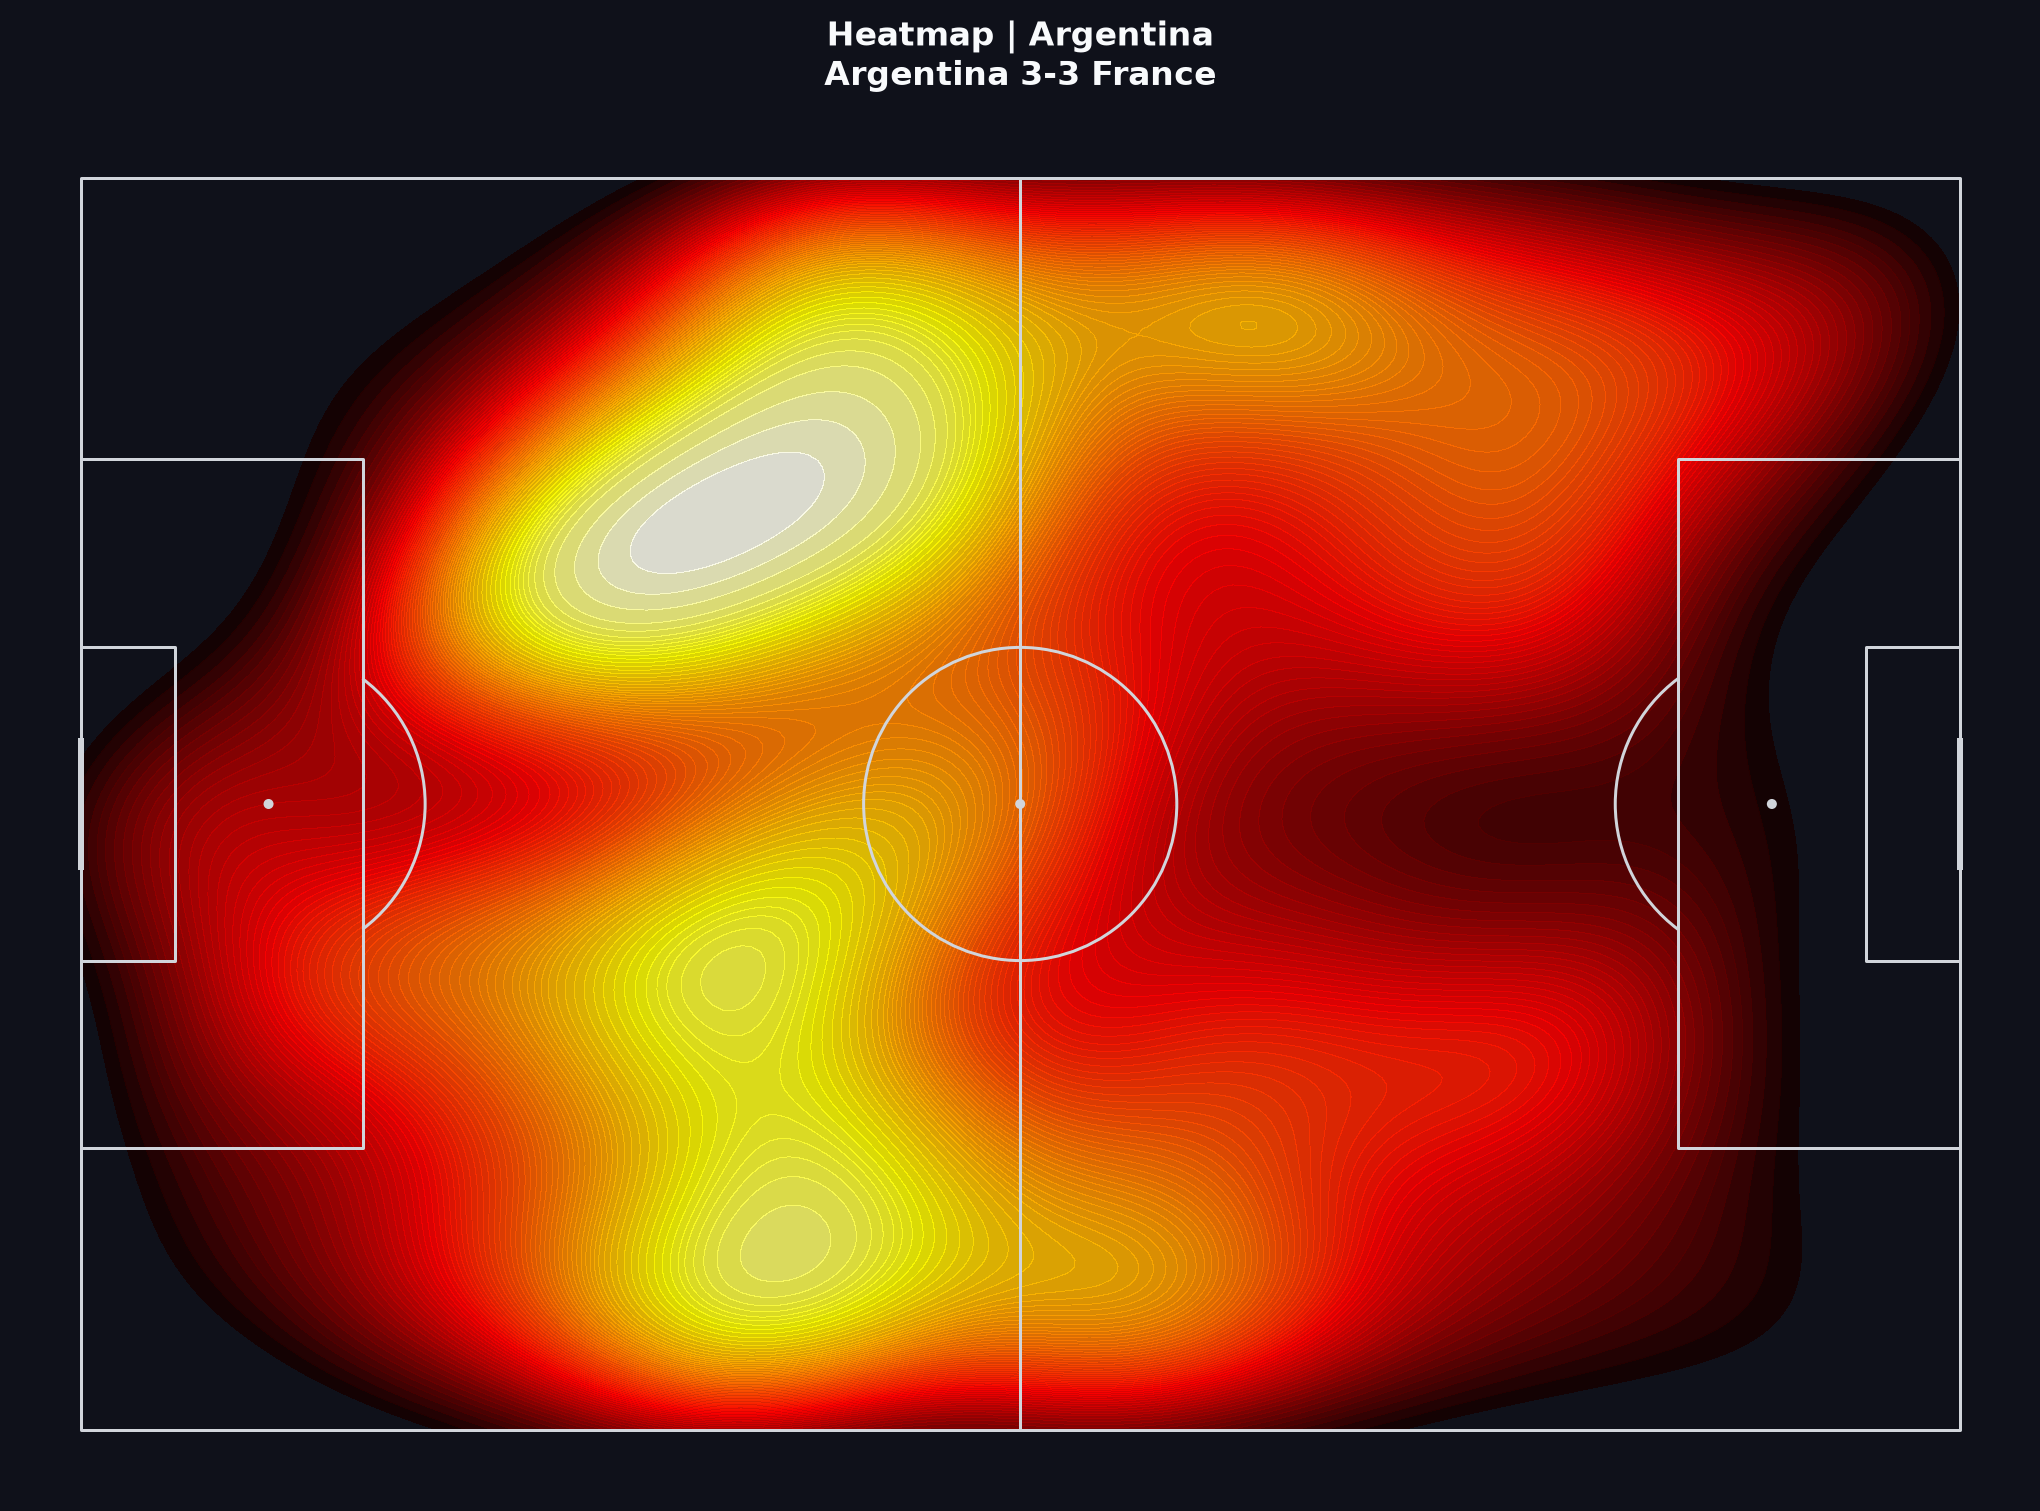
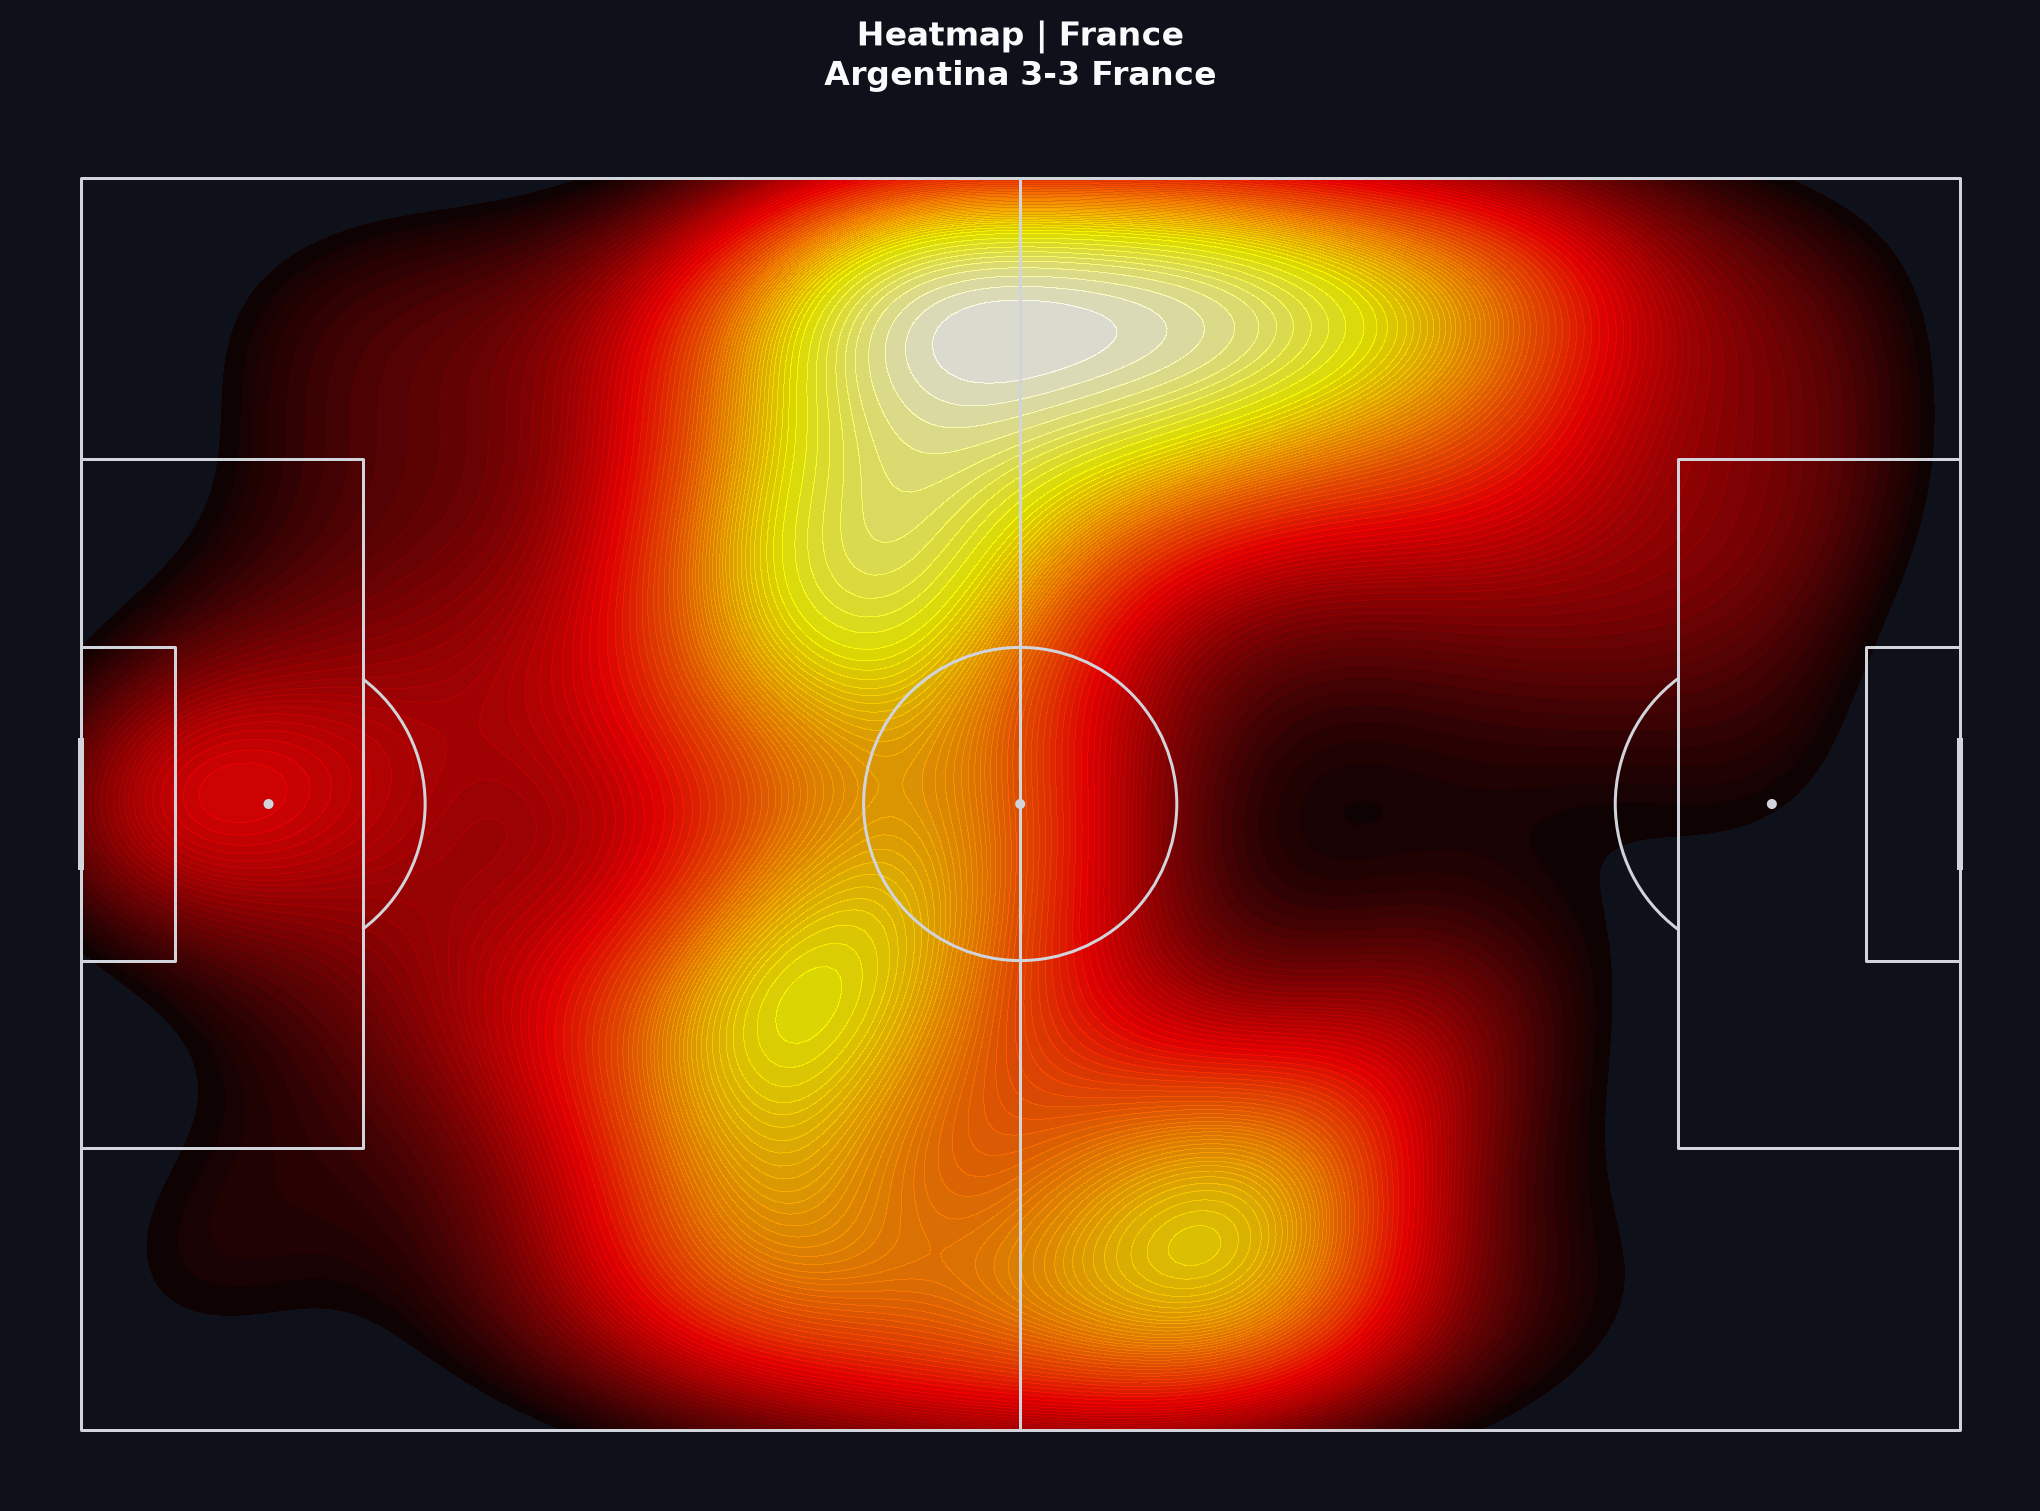
- Heatmaps (linked assets in the folder) show density of actions; average positions compress that density into one point per player. Use both ideas, not one alone.
相关 Learn 课程
综合理解
收尾说明为准确性保留英文。
A responsible short report on this final would state the question (for example: how Argentina controlled progression before France’s late surge), show evidence by layer (network → progressive passes → shots), and keep the shoot-out analytically separate.
If you are following the Learn path, write five sentences using only claims these visuals can support — then note what still requires video.
练习题
用150-200字说明:(1)关于阿根廷组织进攻的一项论断,(2)关于法国机会质量或时机的一项论断,(3)本场比赛事件数据的一项局限。请将每项论断与上述可视化内容关联。
Event data from StatsBomb’s public World Cup 2022 release. Coordinates use StatsBomb’s pitch model.