
Match Analysis / FIFA World Cup 2022
Quarter-finals · December 10, 2022
England 1–2 France
France won in regulation
New here? This page uses terms like xG, PPDA, and progressive passes. The free Foundations lesson explains them in a few minutes. Continue on the Learn path →
Al Bayt Stadium · StatsBomb Open Data
Why this match is useful for learning
- England finished 1–2 against France in regulation. Combined xG (open play and set pieces together) favours England (~2.35 vs ~0.84) because of restarts, including two penalties. Open-play xG keeps only shots from open play: France’s open-play process is larger (~0.63 vs ~0.16). The winning goal is still a set-piece sequence from a corner (~0.15). Split the shot list before talking about the scoreline. A larger combined number is not a verdict on the result.
Match context
France lead 1–0 after Tchouaméni’s low-xG open-play shot around 16′ (~0.03). Kane equalises from the first penalty around 53′ (~0.78). Giroud scores from a corner sequence around 77′ (~0.15). Kane’s second penalty around 83′ (~0.78) is off target and stays in the shot-process sample.
There is no penalty shoot-out in this file. Both in-match penalties are high-xG restarts inside regulation. Do not read England’s ~2.35 combined xG as open-play build-up.
Regulation
Figures below cover regulation. Both in-match penalties are included in shots and xG. They are restarts, not a shoot-out slice. Open-play and set-piece notes use StatsBomb play_pattern and shot type. Penalty and Free Kick count as restarts. From Corner, From Free Kick, and From Throw In count as set-piece phases. Regular Play and similar live-ball patterns count as open play.
- England
- 16 shots · 1 goal · ~2.35 xG
- Progressive passes: 87 (18.7% of passes)
- France
- 8 shots · 2 goals · ~0.84 xG
- Progressive passes: 76 (23.2% of passes)
Visual 1
xG Timeline
England finish ahead on combined xG (open play and set pieces together) (~2.35 vs ~0.84). The steep second-half rise includes two penalties: one goal and one miss. France’s line moves earlier through a very low-xG open-play goal, then again through Giroud’s corner finish. This chart is not a verdict on the result.
The line adds xG when a shot is recorded. A flat stretch means no shot, not that nothing happened. This is not xT and not a possession-value chart. The line is not a verdict on the result.
- 16′ · France · Aurélien Djani Tchouaméni · 0.03 xG
- 53′ · England · Harry Kane · 0.78 xG
- 77′ · France · Olivier Giroud · 0.15 xG
How to read this
- Mark the two penalty spikes (~0.78 each, around 53′ and 83′). Together they exceed England’s entire open-play xG sample (~0.16).
- Compare goal markers with phase. Tchouaméni’s opener (~0.03) is low-xG open play. Kane’s goal is a high-xG restart. Giroud’s winner (~0.15) is a set-piece sequence.
- A flat stretch means no shots, not no football. Possession without a shot will not move this line.
Limitations
- xG describes historical shot types. It does not measure build-up quality before the shot.
- A goal marker shows when the ball entered the net, not whether that chance was high xG.
- Both in-match penalties belong in this process sample as restarts. They are not extra open-play build-up.
Related Learn lessons
Visual 2
Half vs half
First half: England have 0.39 xG from five shots and no goal. France have 0.31 xG from three shots and the opener. Second half: England have 1.96 xG from 11 shots and the penalty goal. France have 0.53 xG from five shots and the winner. Most of England’s second-half xG is two penalties. Event data has no distance run. This is not a fatigue table.
| Metric | First half | Second half | ||
|---|---|---|---|---|
| England | France | England | France | |
| xG | 0.39 | 0.31 | 1.96 | 0.53 |
| shots | 5 | 3 | 11 | 5 |
| Progressive passes | 47 | 40 | 40 | 36 |
| PPDA | 113† | 29.67 | 9.22 | 133† |
The table splits the same process by half: shots, xG, progressive passes. Event data has no distance run. This is not a fatigue table. Read shots and xG together. Then ask how much came from open play vs set pieces.
PPDA (teaching definition): opponent passes starting in their own half ÷ Tackle + Interception + Foul Committed by this team in the opponent’s half. A dash or † means the sample of defensive actions is empty or tiny — often a deep block, not a physical ranking. Do not read half changes as proven fatigue.
How to read this
- England’s second-half xG jump (0.39 → 1.96) is mostly two penalties (~1.57 of that 1.96). Label the restarts before claiming an attacking surge.
- Progressive Passes stay in a similar band by half: England 47 then 40, France 40 then 36. Advancement can continue without the combined-xG story being an open-play story.
- PPDA here is a teaching proxy. Thin denominators are too weak for a fitness ranking.
Limitations
- Half splits are still small samples. A thin open-play swing is usually too weak for a structural law.
- PPDA here is a teaching proxy (see footnote). A thin denominator is often a deep block, not a physical ranking.
- Event data has no distance run. Do not read a second-half change as proof of tiredness.
Related Learn lessons
Visual 3
Transition board
Recoveries are even (51 vs 51). France convert a higher share into a Progressive Pass or shot within 10 seconds (~43% vs ~33%). After England turnovers, France more often progress or shoot in the same window (~35% vs ~18%). This is a secondary timed proxy, not the set-piece lesson.
England
- Recoveries (possession starts)
- 51
- Positive transitions
- 17 (33.3%)
- Turnovers (possession ends)
- 51
- Negative transitions
- 18 (35.3%)
France
- Recoveries (possession starts)
- 51
- Positive transitions
- 22 (43.1%)
- Turnovers (possession ends)
- 51
- Negative transitions
- 9 (17.6%)
Recovery = new possession after the opponent had the ball. Turnover = that possession ends. Positive rate = share of recoveries followed within 10 seconds by a progressive pass or a shot. Negative rate = share of turnovers after which the opponent progressed or shot within 10 seconds. A higher negative rate means giving the ball away was more costly in this window. It is not a fitness ranking.
Window: 10s after recovery/turnover for a progressive pass or shot. Approximate event-data proxies — not tracking. They do not show how a team is set when possession is lost.
How to read this
- Positive transition rate: share of recoveries followed within 10 seconds by a Progressive Pass (~12 m forward) or a shot.
- Negative transition rate: share of turnovers after which the opponent progressed or shot within 10 seconds. Higher is more costly in this window.
- Even recovery counts beside uneven combined xG make sense once restarts dominate one team’s shot value. These rates are not a verdict on the result.
Limitations
- Recoveries and turnovers are inferred from StatsBomb possession changes. Restarts and fouls make the counts approximate.
- “Positive” only means a Progressive Pass or shot followed within 10 seconds. It is not proof of a planned counter-attack.
- Event data has no sprint distances and no continuous off-ball picture.
Related Learn lessons
Visual 4
Shot map
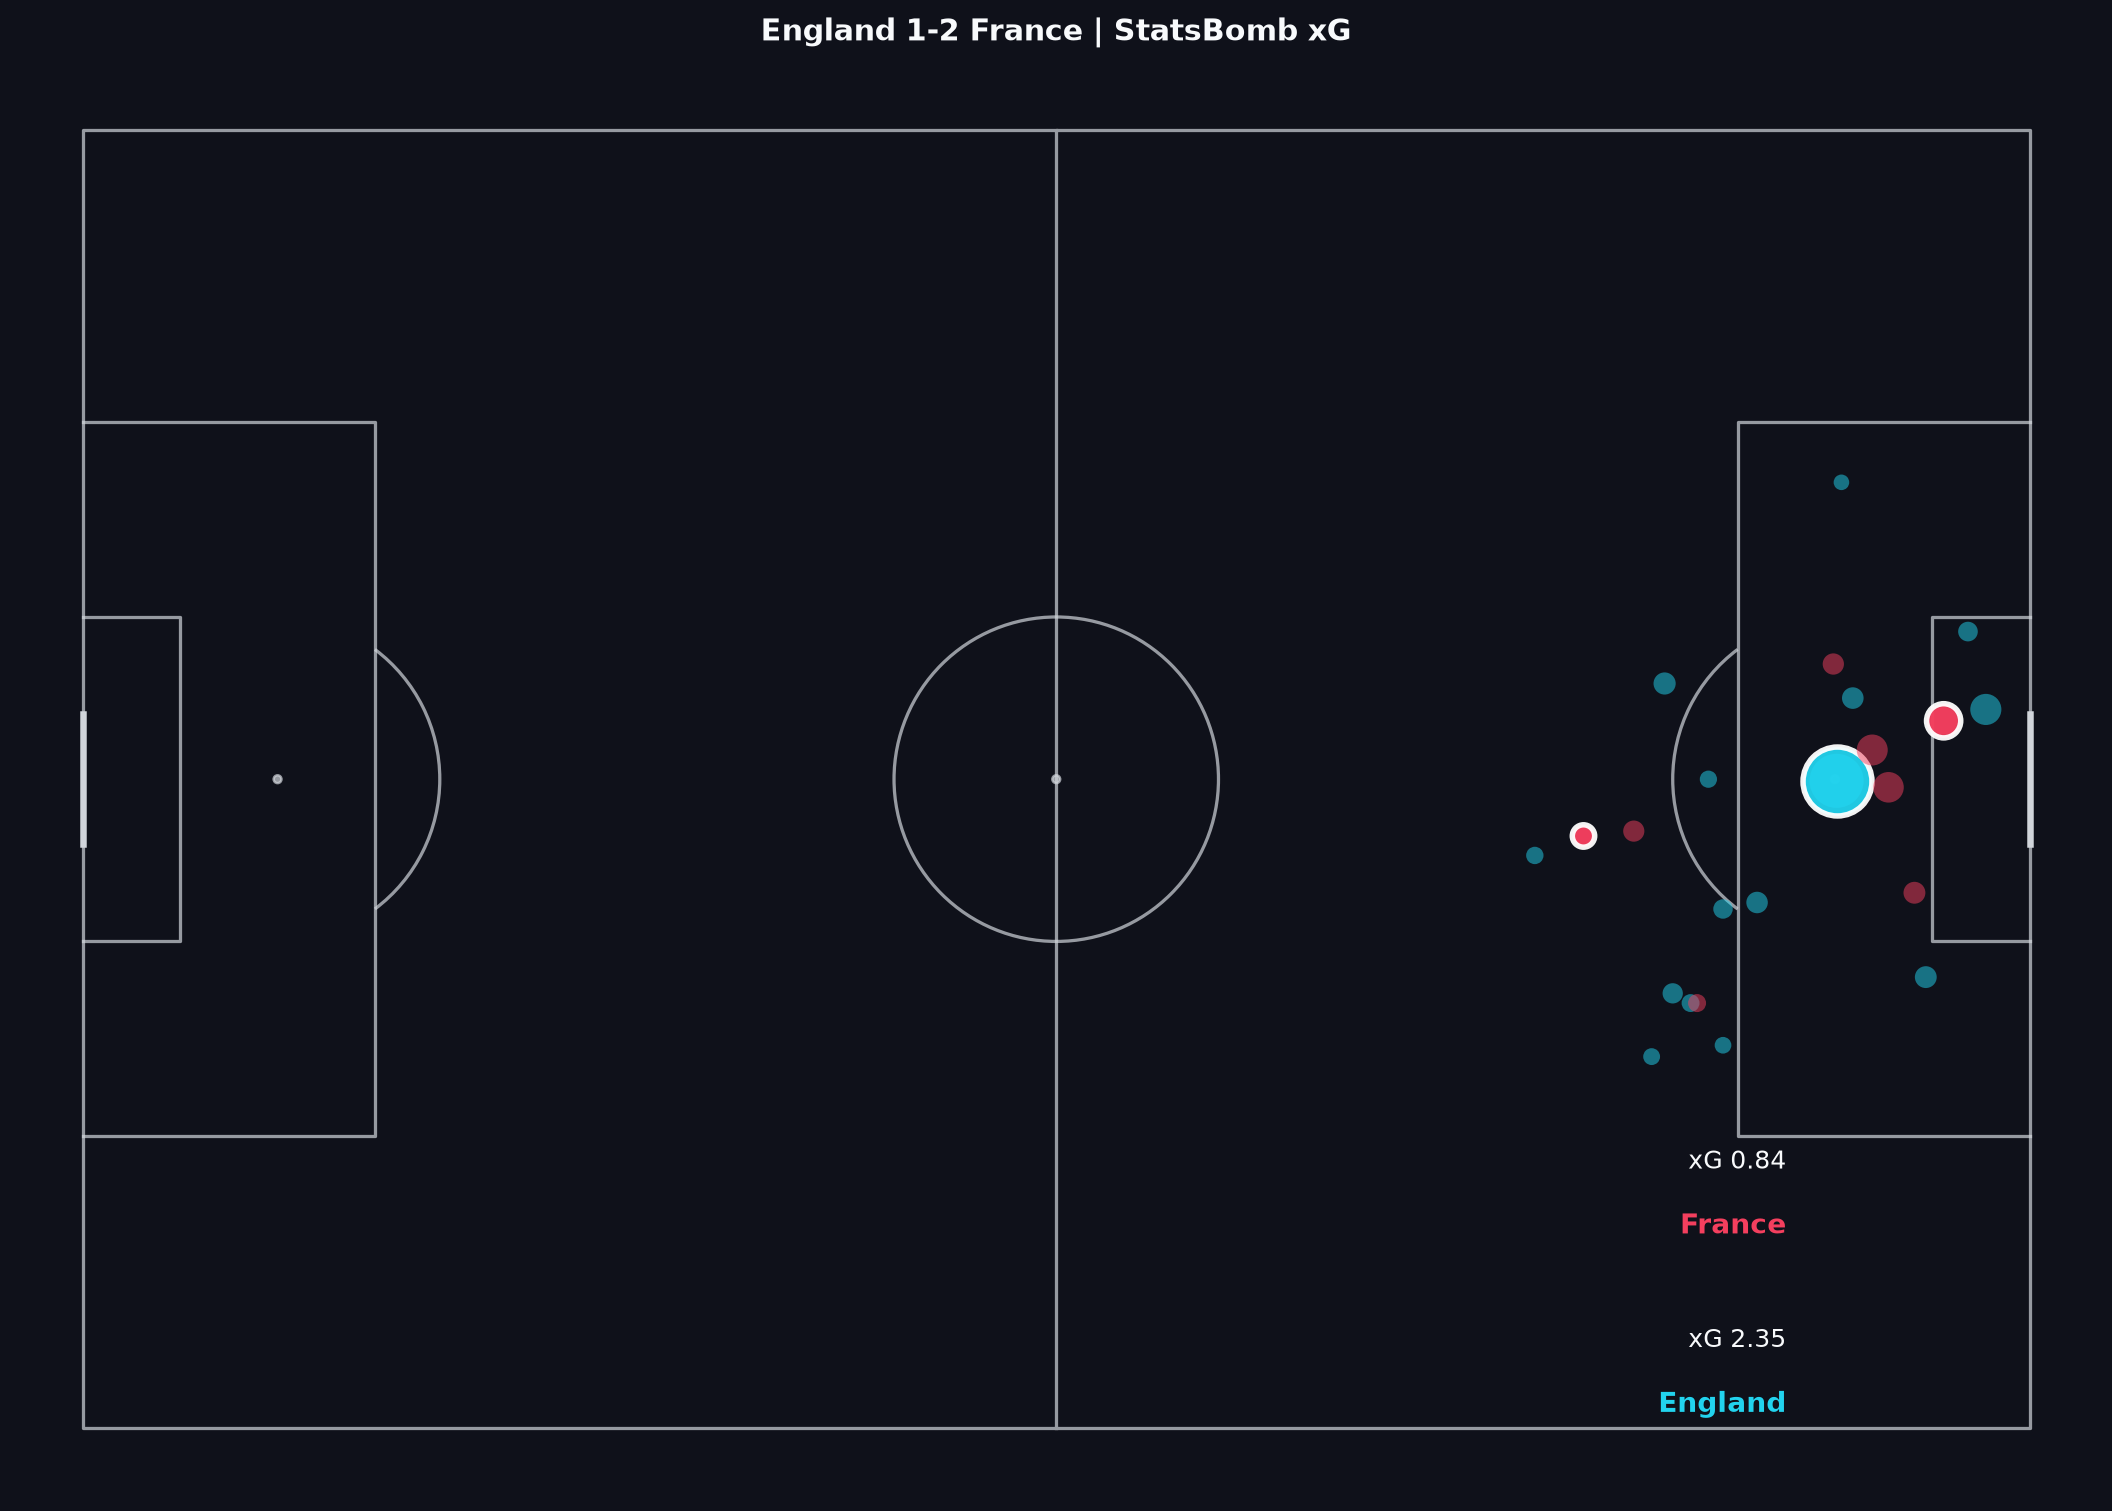
England’s markers include two penalty spots (~0.78 xG each) plus lower-xG attempts from corners, throw-ins, and open play. France’s smaller sample includes the low-xG opener and Giroud’s corner-sequence winner. Read location with phase. A penalty is not open-play craft.
How to read this
- Start with location and quality, then ask how the chance started. Two high-xG dots on the penalty spot are restarts.
- Mark Tchouaméni’s low-xG goal (~0.03) against Kane’s missed penalty (~0.78). Conversion noise cuts both ways.
- England recorded 16 shots, France 8. England’s quality is concentrated in restarts; France’s open-play sample is the larger of the two.
Related Learn lessons
Visual 5
Pass network
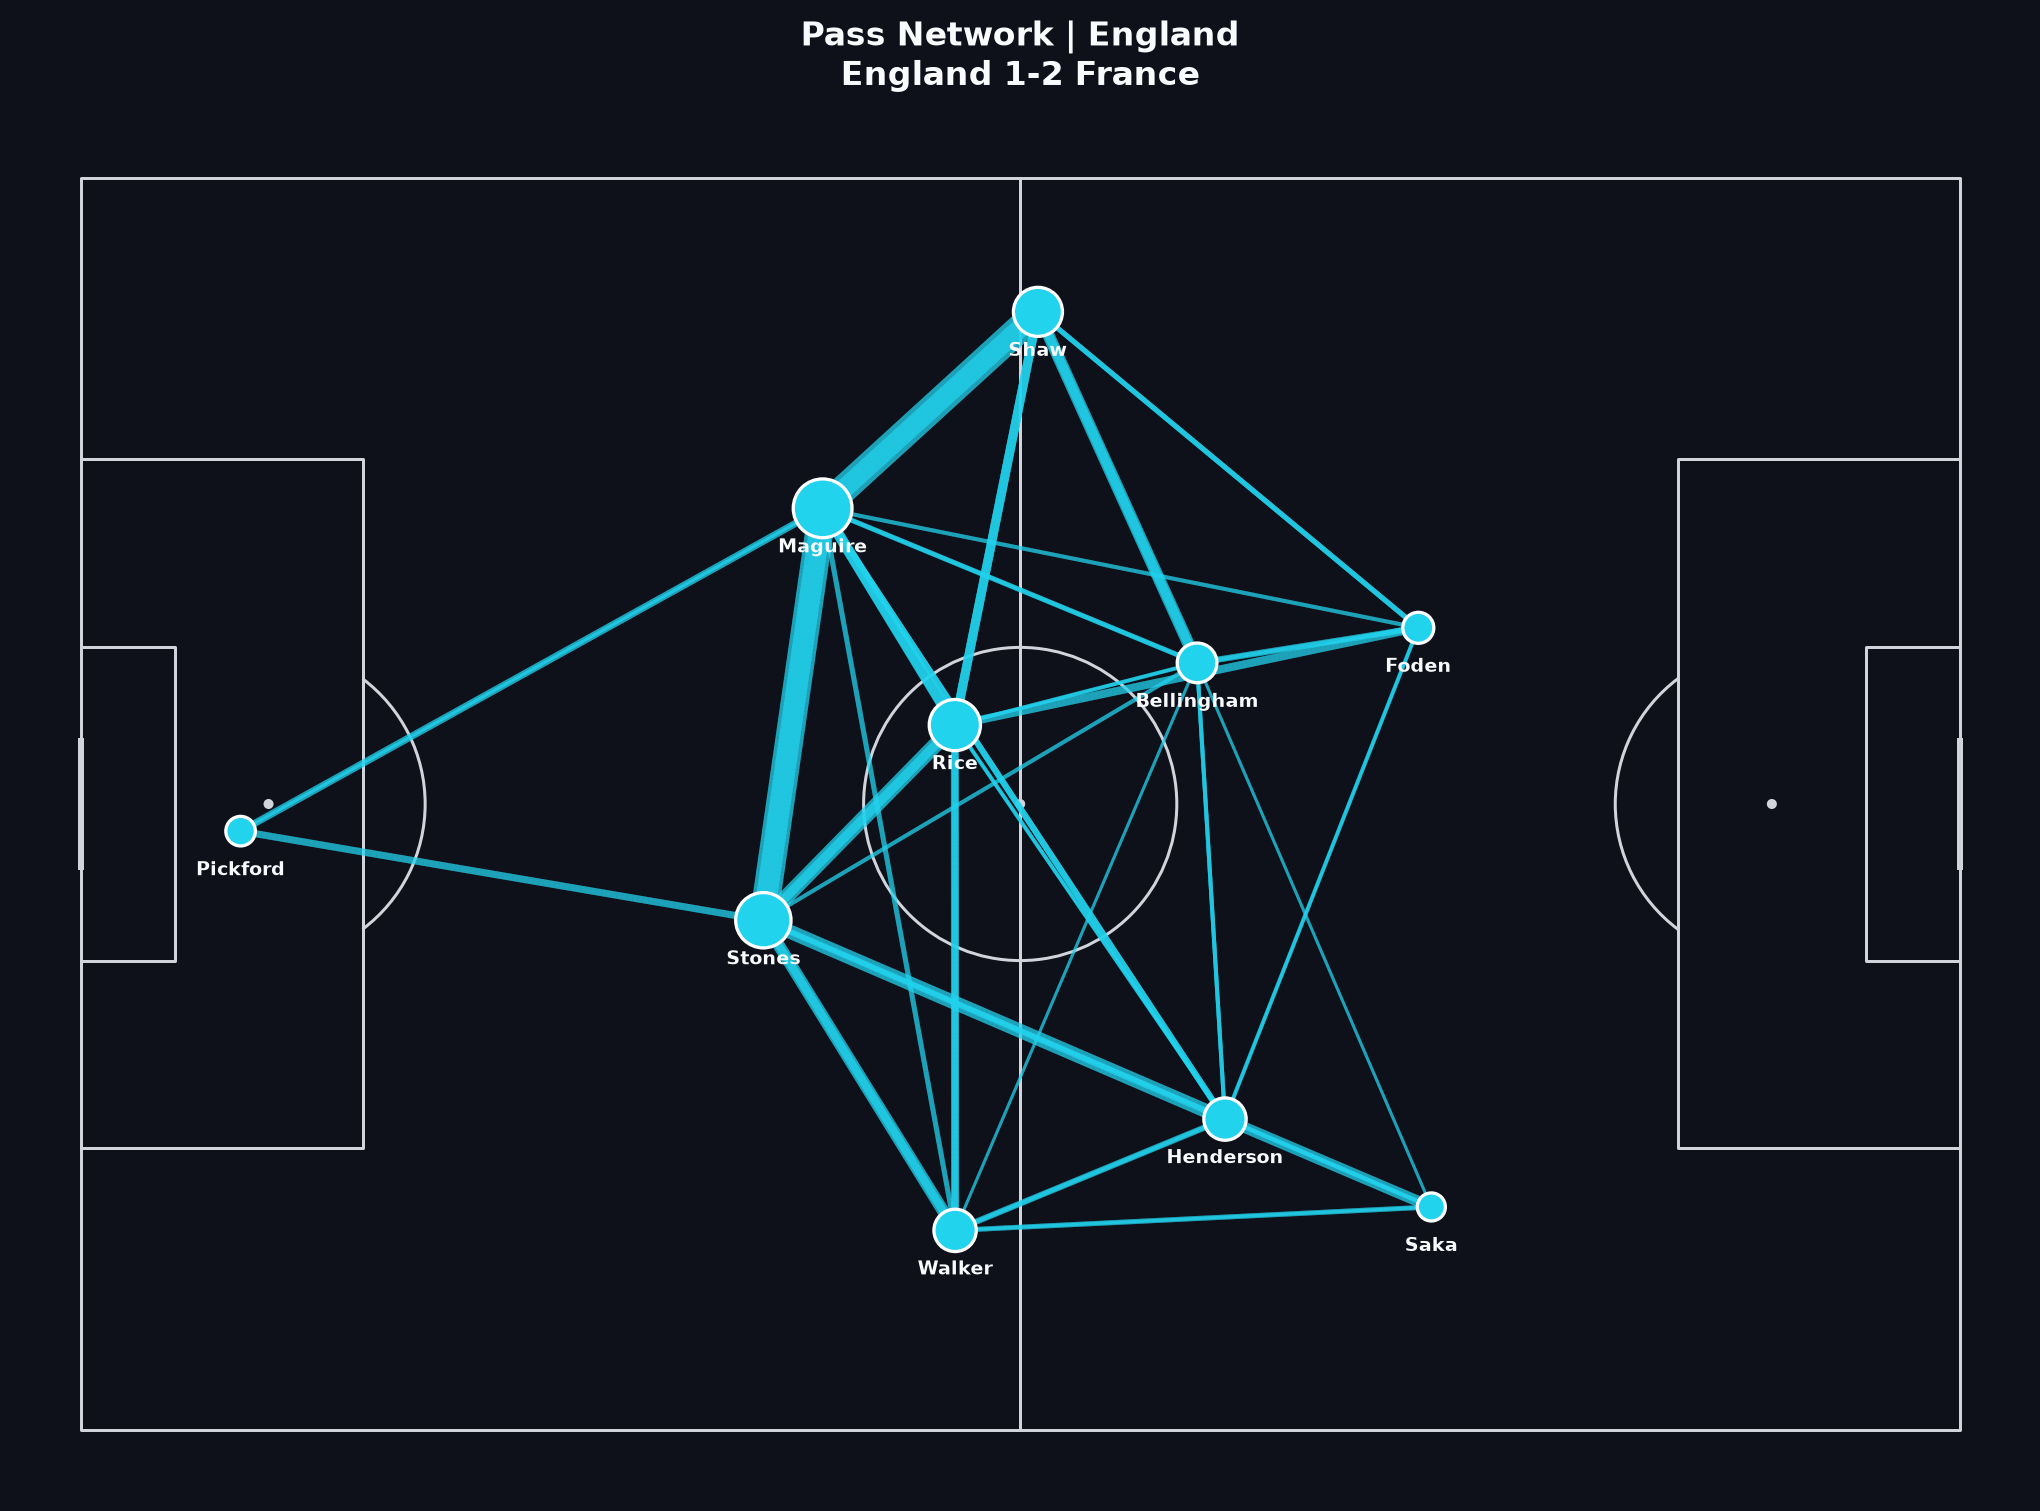
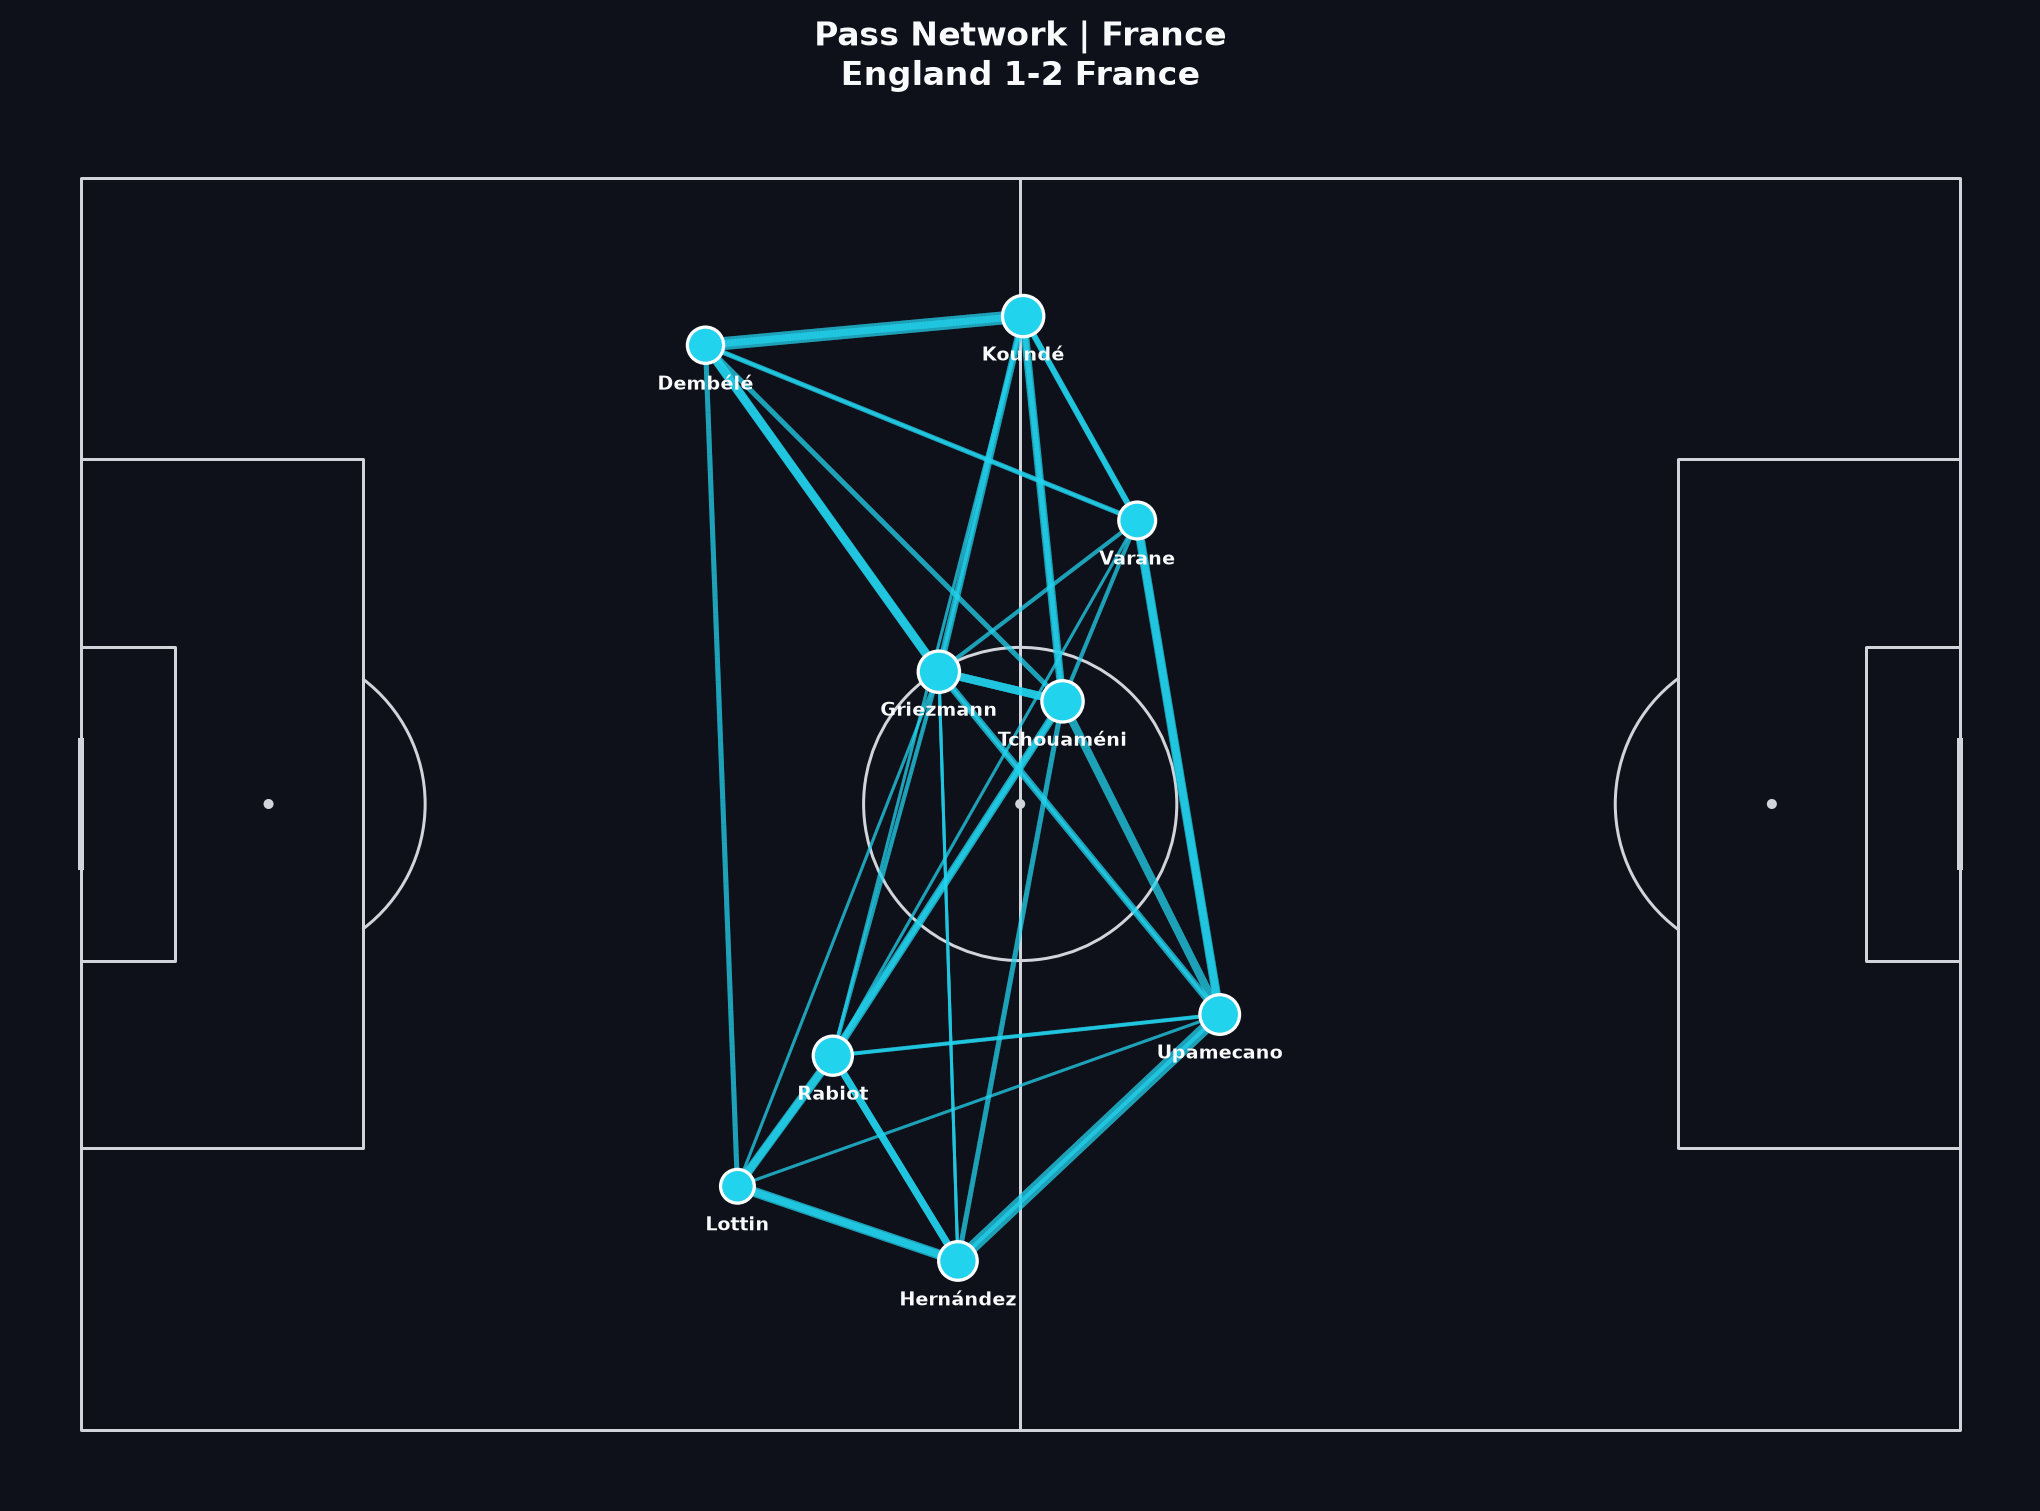
England’s network is denser on more completed passes (~465 vs ~328). Density measures combination frequency. It does not explain the combined-xG gap by itself. Most of that gap is restarts, and France still have the larger open-play xG sample.
How to read this
- Look for English hubs between build-up and the final third. Frequent combinations can support territorial presence; they do not automatically produce open-play box chances.
- France’s lighter graph can still show real circulation. A thinner network is not proof that they did not try to play.
- Game state matters: the picture averages a 0–1, a 1–1, and a 1–2 into one graph.
Related Learn lessons
Visual 6
Progressive passes
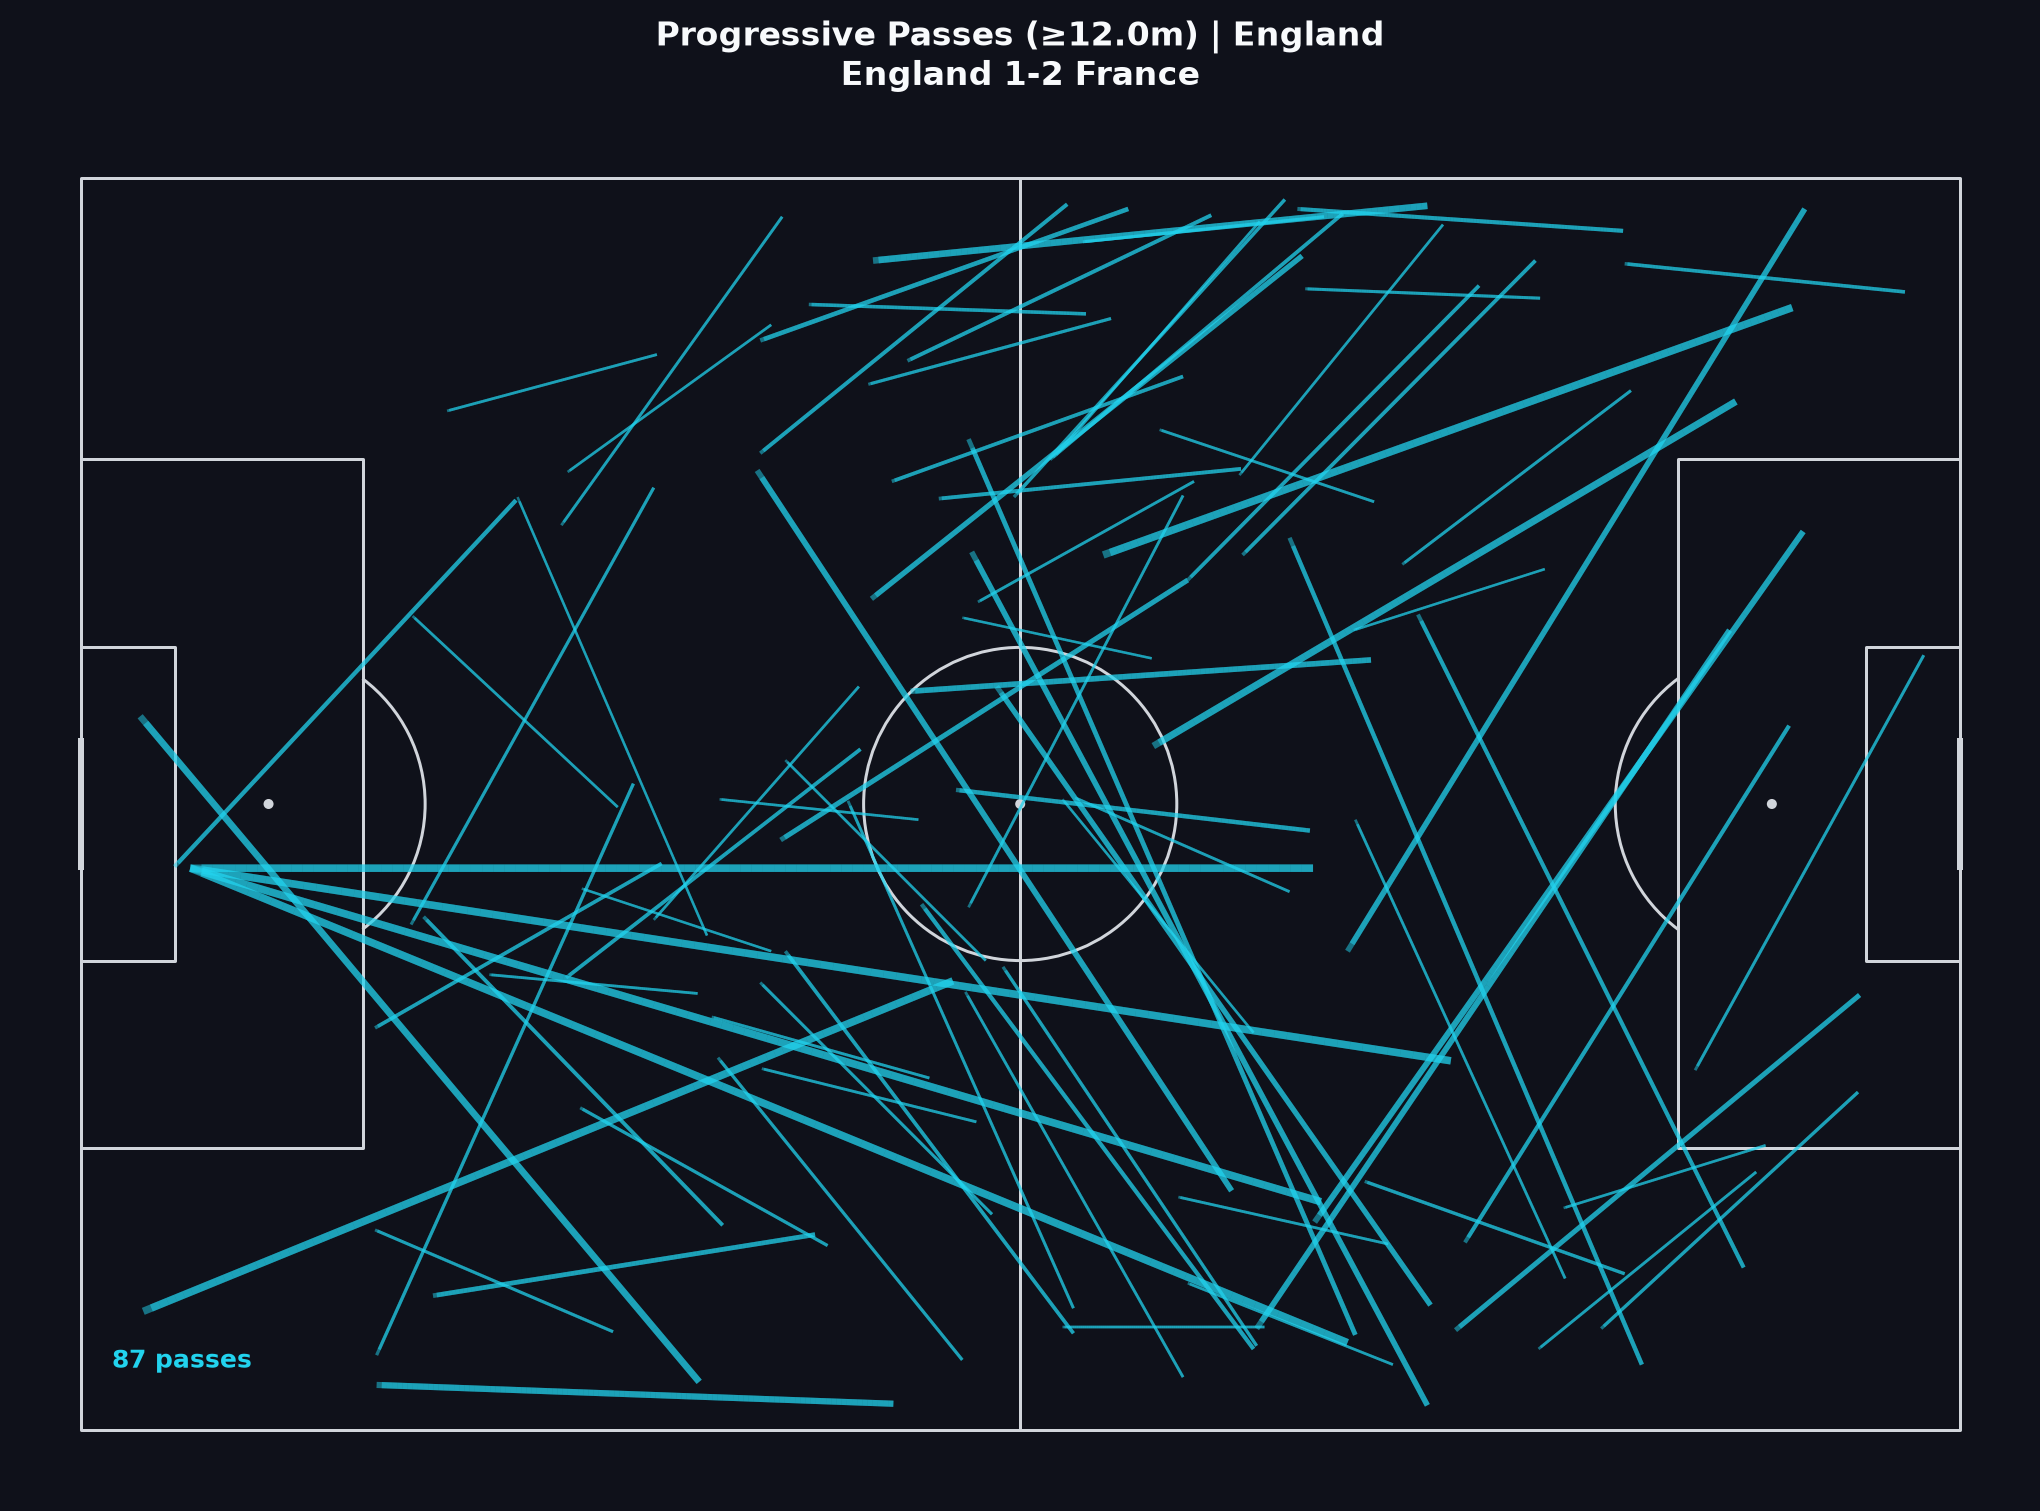
England complete more Progressive Passes in absolute terms (~87 vs ~76) on more completed passes. Progressive share favours France (~23% vs ~19%). Combined xG still favours England because of restarts. Advancement rate, pass volume, and shot-phase mix are three separate questions.
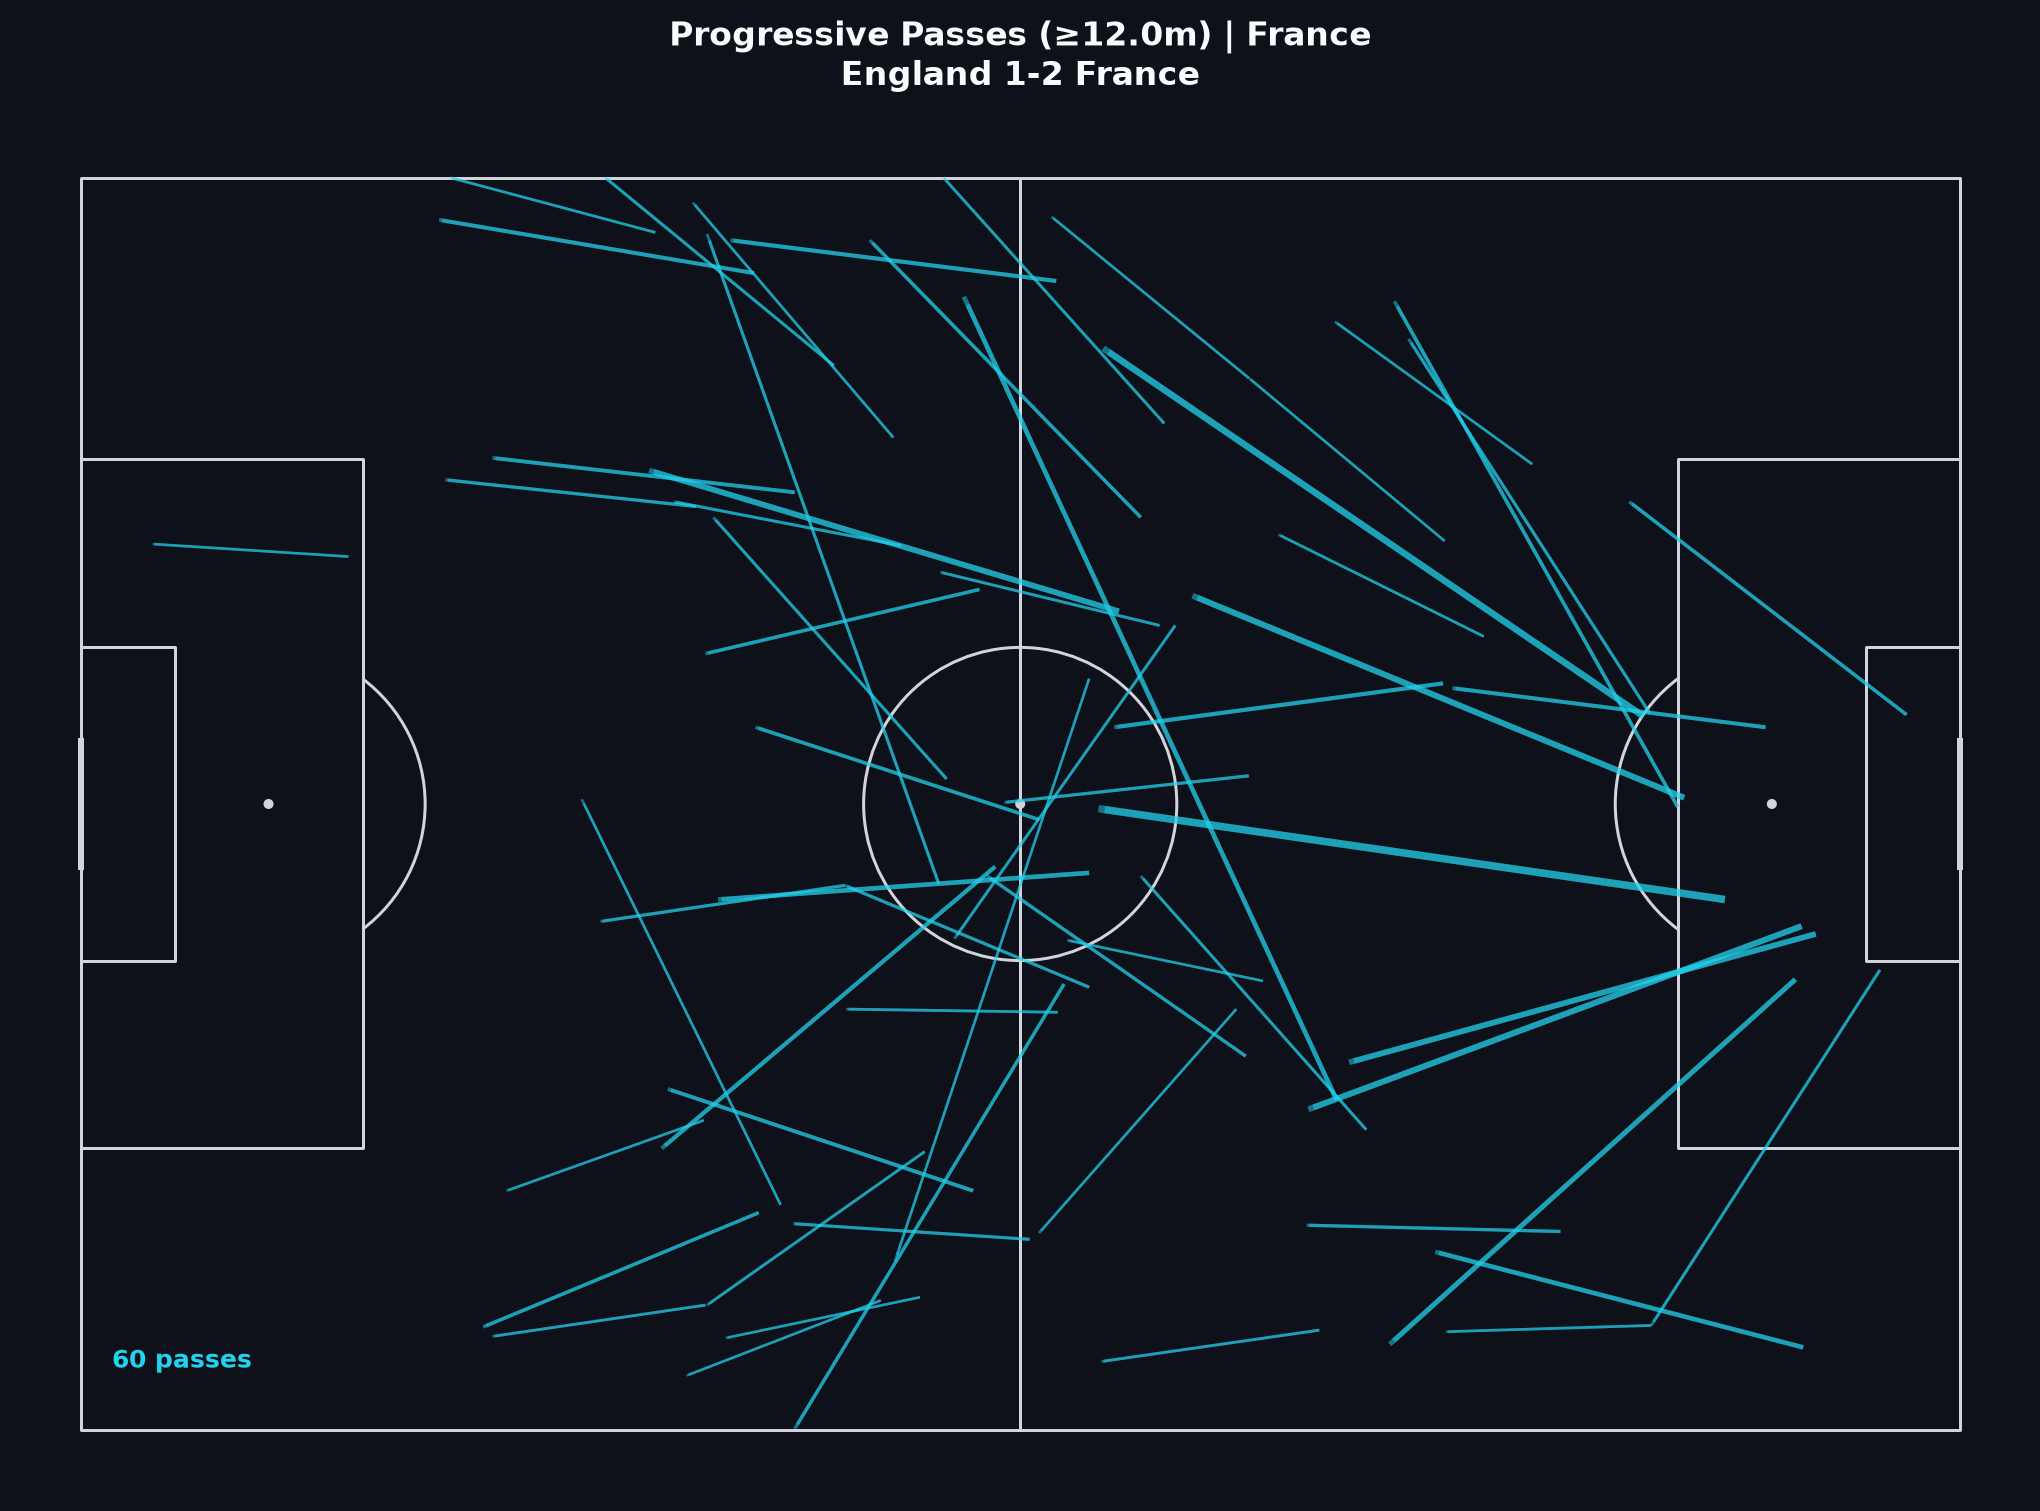
How to read this
- Separate absolute progressive volume from progressive share. Here France’s share is higher; England’s completed-pass volume is higher; England’s combined xG is higher because of restarts.
- Trace end zones. Progression that dies outside the box is different from progression that feeds open-play shot locations.
- A Progressive Pass is a completed pass with at least ~12 metres of forward gain on the StatsBomb x-axis. It is not Expected Threat (xT).
Related Learn lessons
Visual 7
Average positions
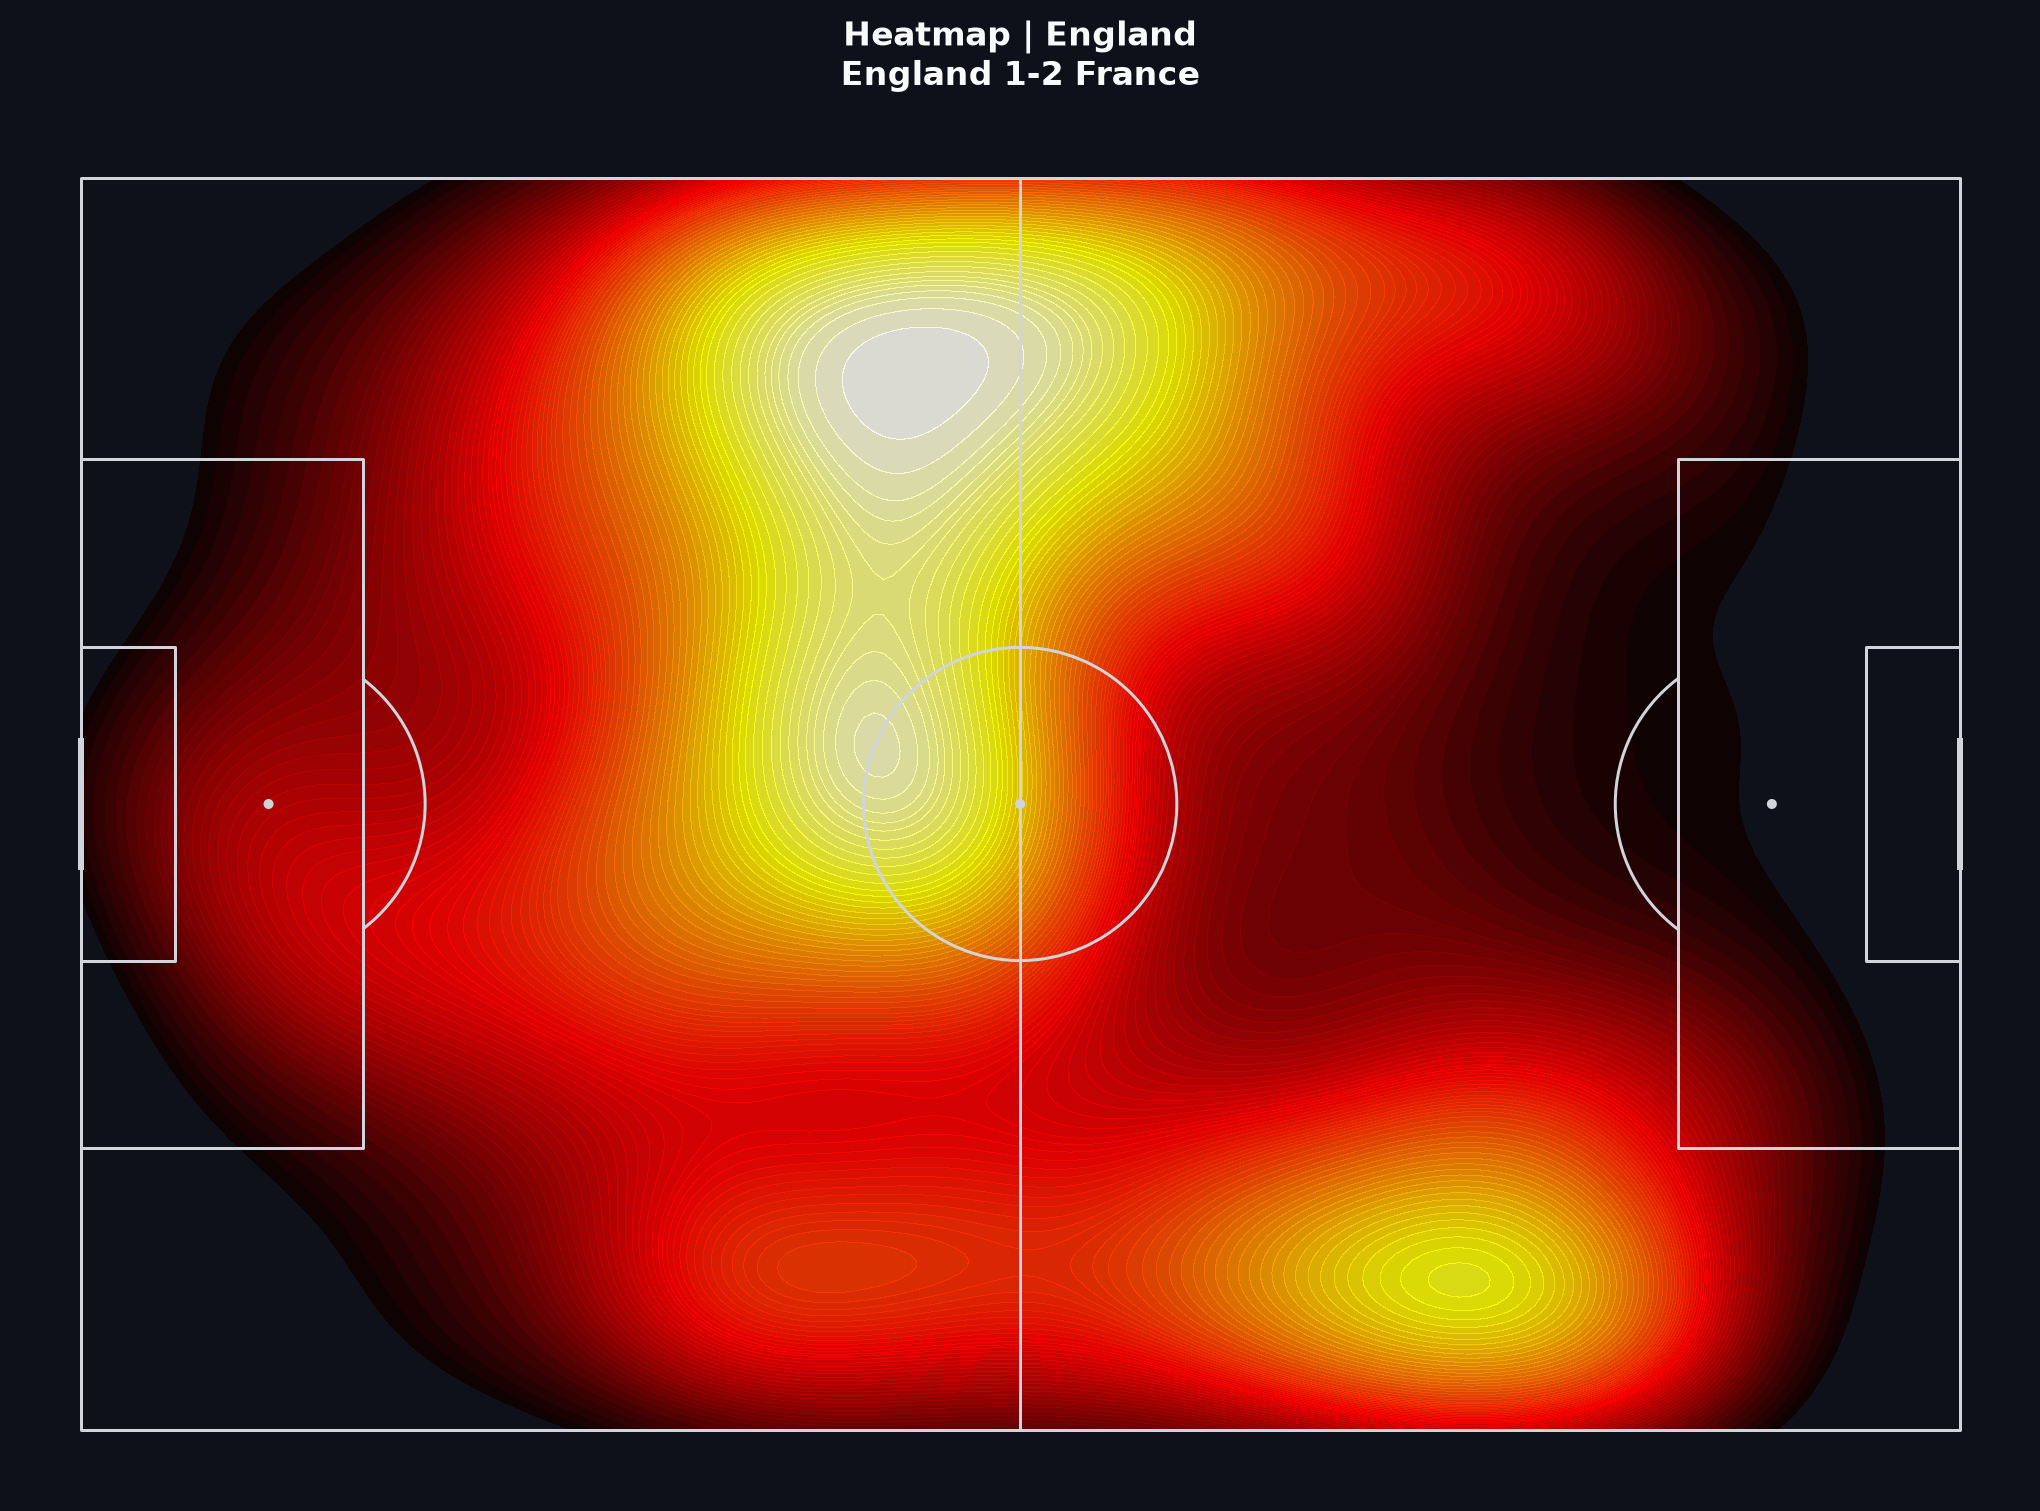
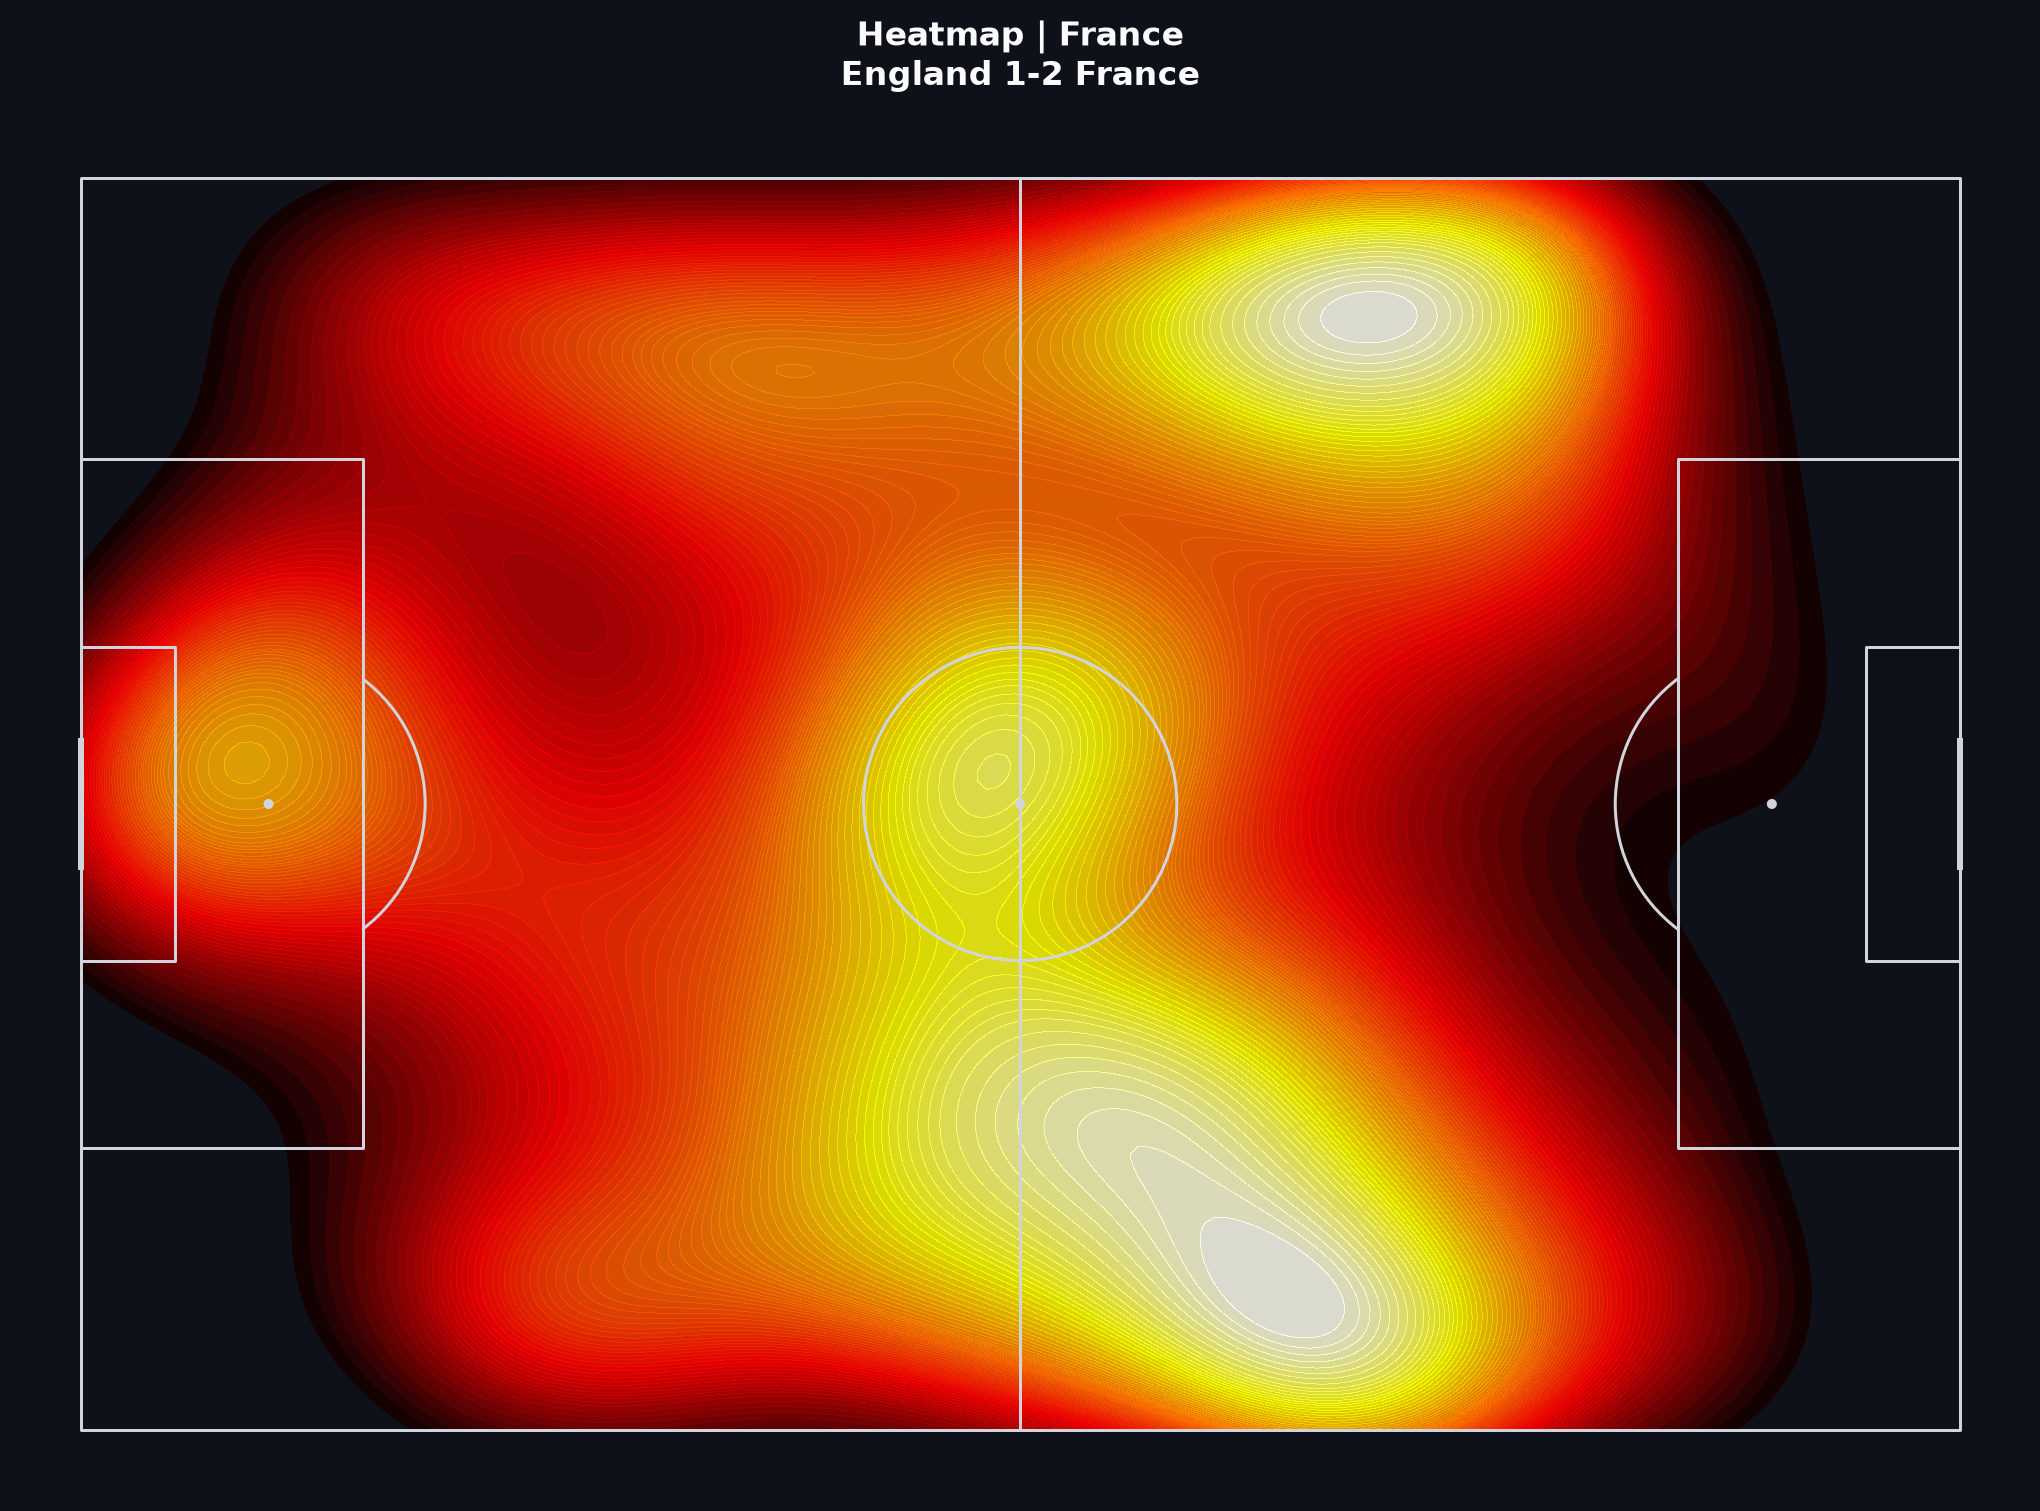
Average Positions compress 0–1, 1–1, and 1–2 states into one picture. Use them with Heatmaps as a territorial hypothesis. Then check the Shot Map with set-piece and open-play labels before claiming control.
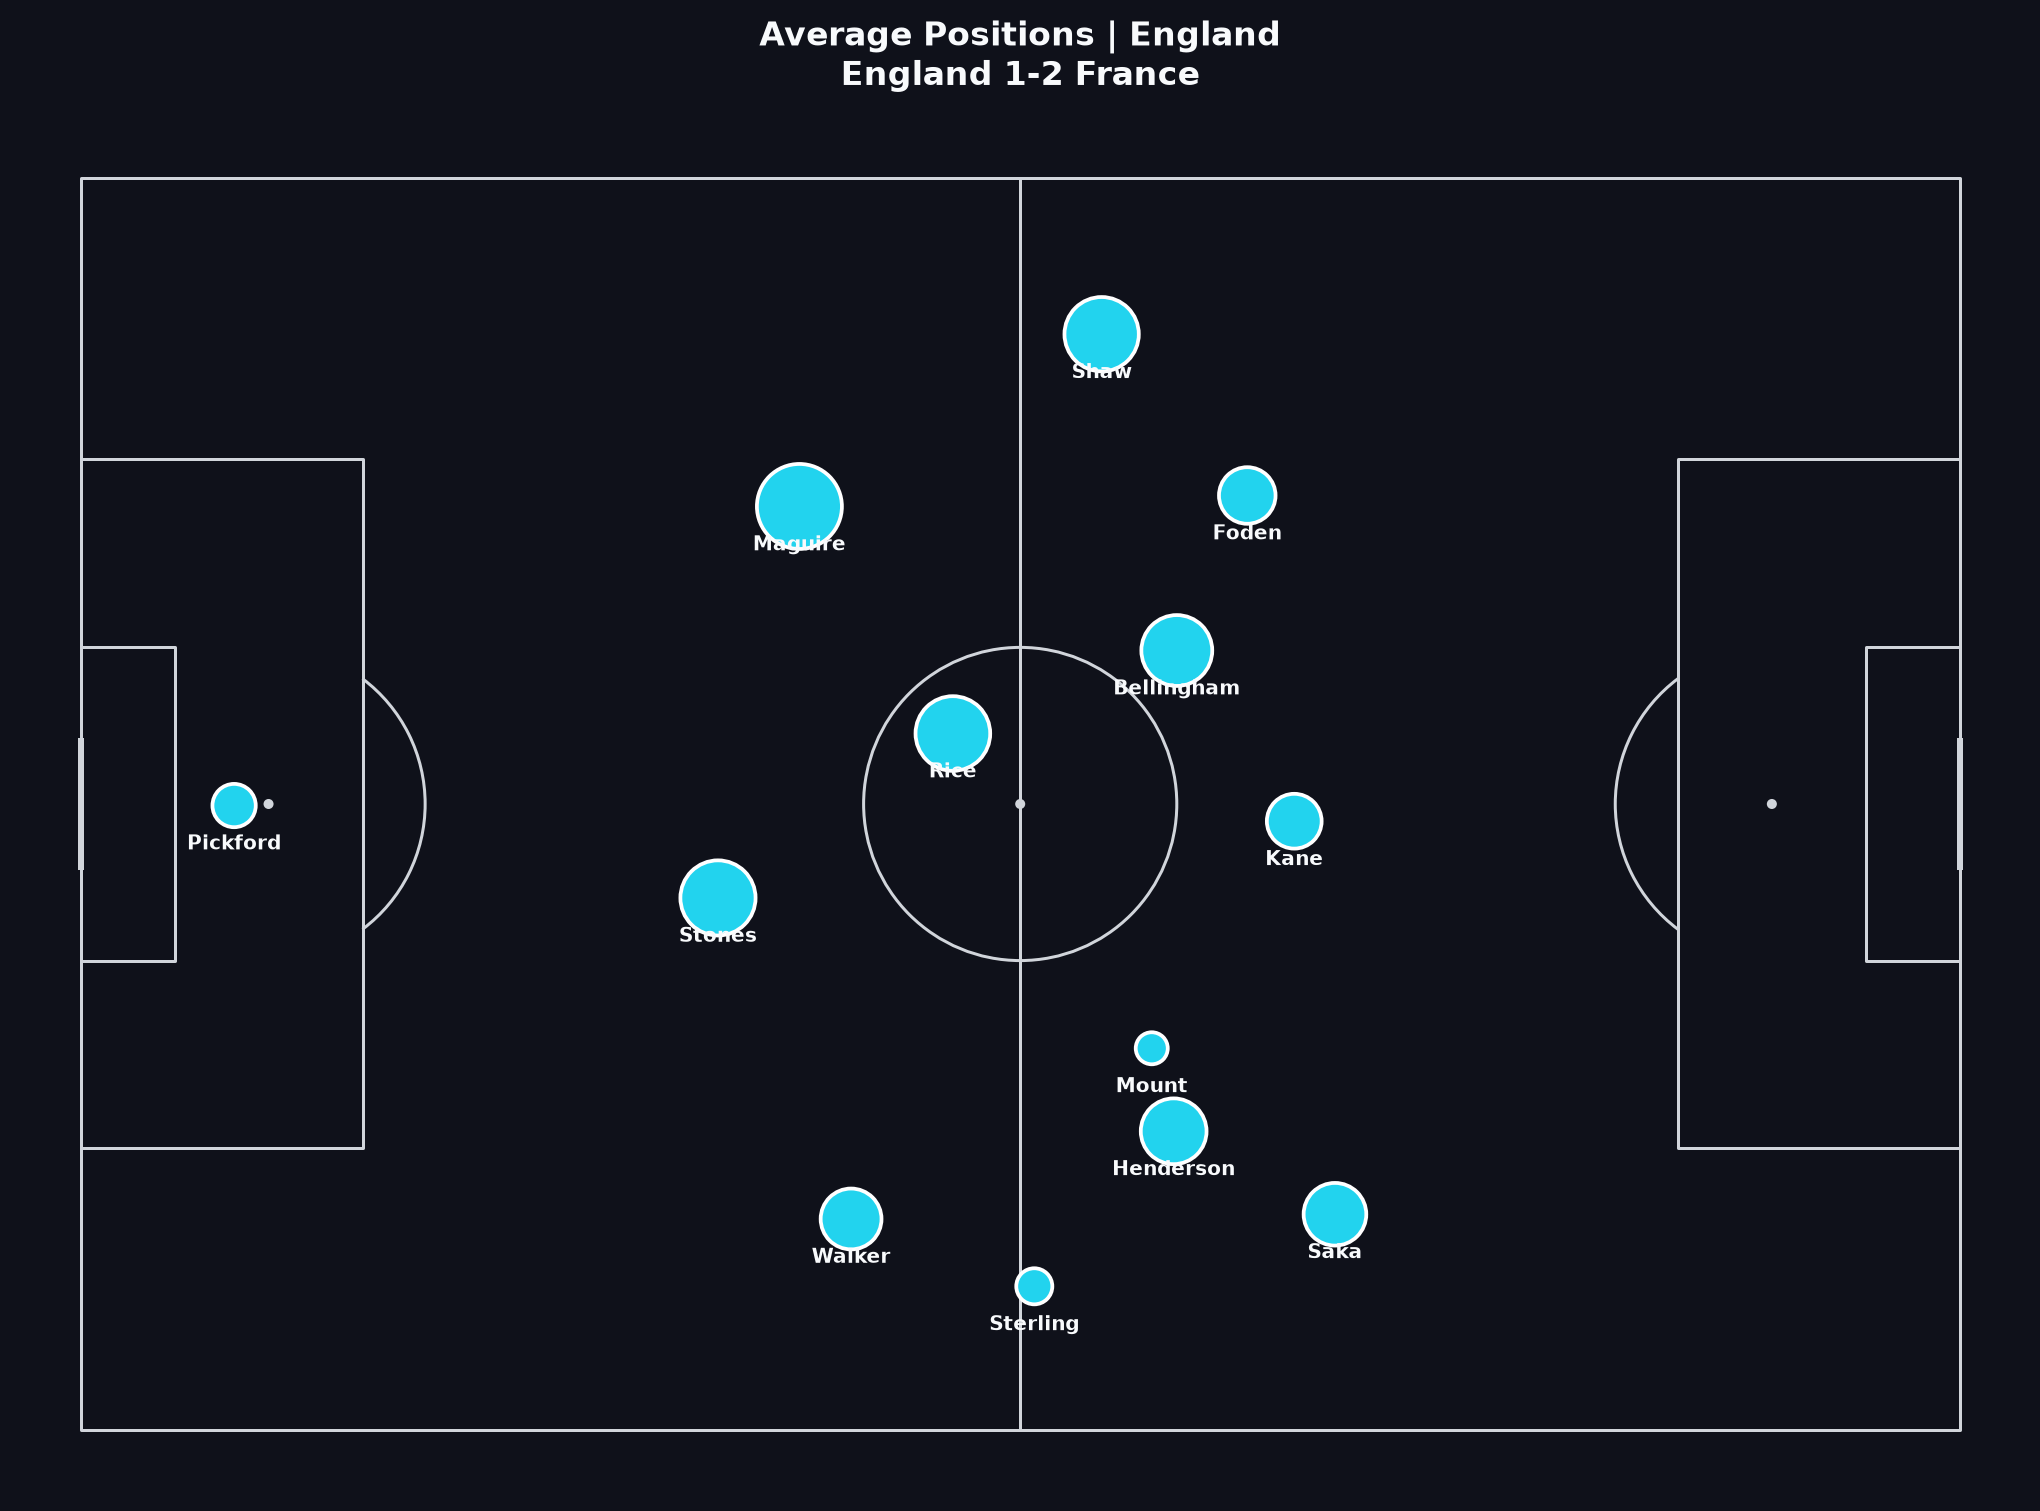
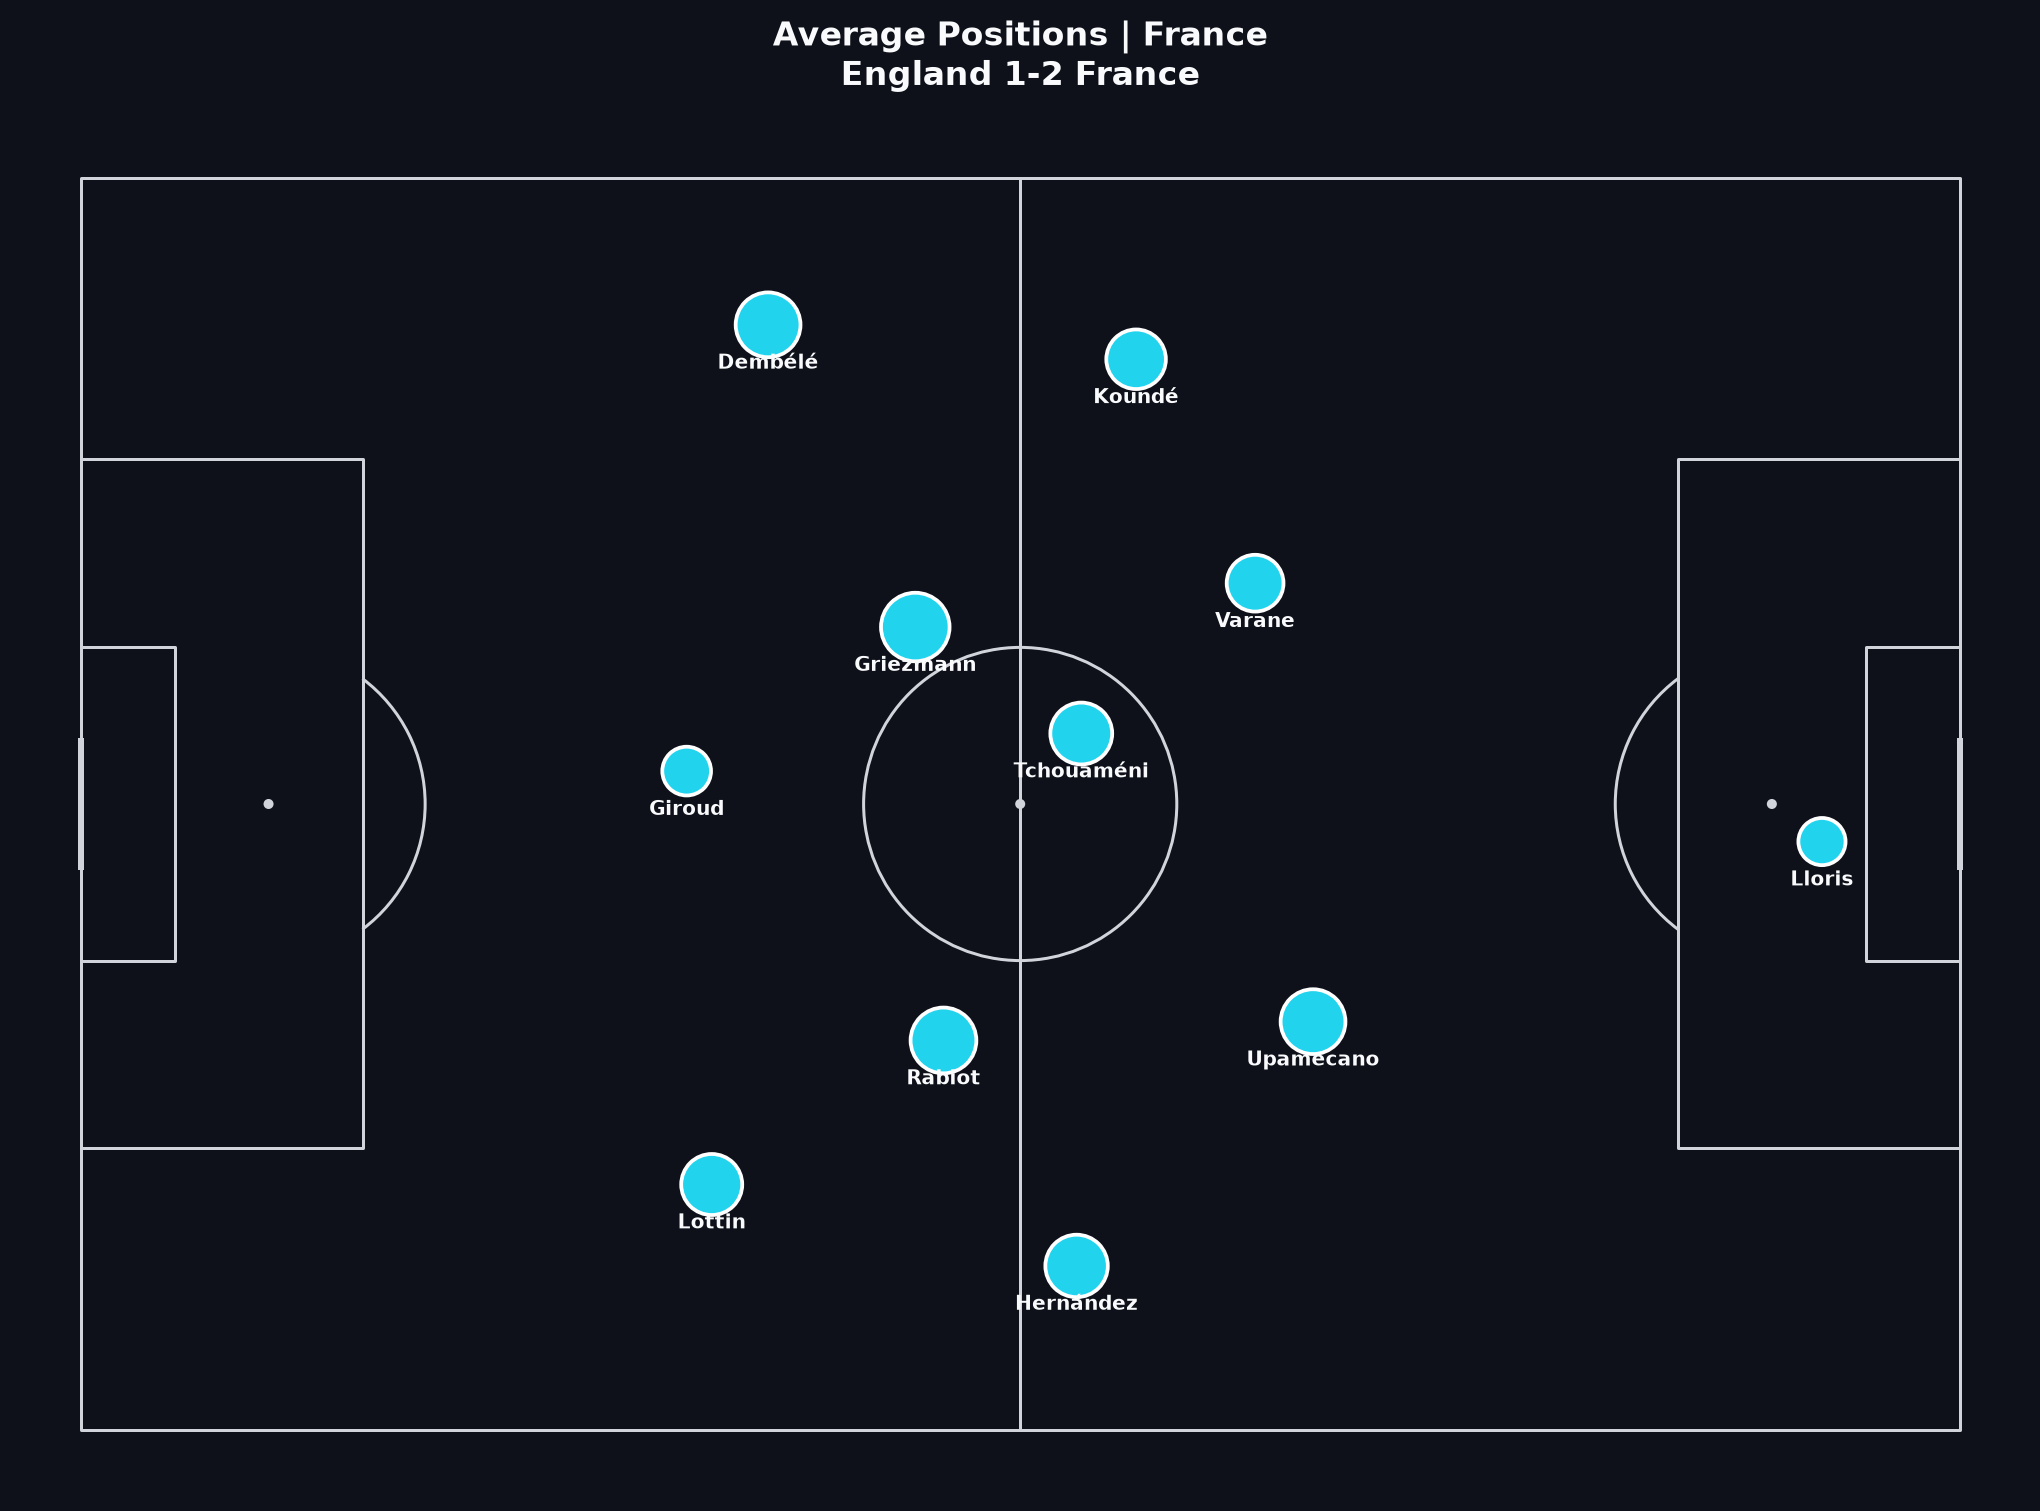
How to read this
- English averages may sit higher when on-ball actions cluster toward France’s goal. That is involvement location, not proof of open-play chance quality.
- Heatmaps (below) show density piles that a single average point can hide — especially for wide attackers or late substitutes.
- Form a question about height of involvement, then verify on video. StarkPitch does not print a Field Tilt number on this page.
Related Learn lessons
Putting it together
A short report should separate England’s combined-xG lead from their open-play xG deficit. Name both penalties as high-xG restarts: one converts, one does not. Keep Giroud’s corner-sequence winner in the set-piece column.
If you are following the Learn path, write five supported sentences from these visuals. Then note what still needs video, especially delivery type on the corner.
Practice prompt
In 150–200 words: write one claim about combined xG versus open-play xG, one claim that treats the two penalties as restarts rather than extra build-up, and one limitation of reading the second half from event data alone. Link each claim to a visual above.
Glossary
Event data from StatsBomb’s public World Cup 2022 release. Coordinates use StatsBomb’s pitch model.